
Table of Contents
The BCG Matrix is a growth-share matrix developed by the Boston Consulting Group in 1968. The BCG matrix is an exceptionally effective tool for interpreting a company’s growth share. The design of the growth-share matrix was a collaborative effort by Alan Zakon, BCG’s first CEO and his colleagues. The popularity of the BCG growth matrix rose through the roof after BCG founder Bruce Henderson wrote about its usage and usefulness in an essay in 1970.
The BCG Matrix has been and is still used by nearly every major corporation across industries. Nearly every Fortune 500 company implements improved business portfolio & resource management.
So, what makes the BCG matrix so useful? What are its features & how to interpret one? This article answers all such questions and more with clear explanations & examples.
The BCG matrix, by definition, is a powerful framework for business portfolio management. The matrix helps businesses understand what is working and what is not. They can thus re-prioritise and make better decisions about different investments & subsidiaries. BCG matrices provide vital info about brand/product performance and competition, thereby, aiding in better resource allocation, strategies, and ROI.
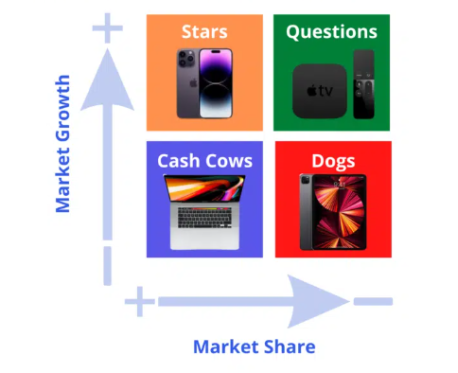
Here is what a typical BCG matrix looks like.

As can be seen, the entire matrix is divided into four quadrants and has two referential axes. The horizontal axis is the market share, and the vertical axis denotes growth.
Let us dig in a bit deeper.
The original BCG Matrix of 1968 defines four different product categories. Each of these possesses unique features.
With the right strategies, there is a chance to overcome competitors and grab a large share. But to do that, a company must invest resources heavily.
Question marks are the wild cards. A company must decide whether to take advantage of the high growth or discard it. If a company decides to invest further, it is aim should be to make the best use of high growth and capture major market share.
A good BCG matrix question mark example can be Apple’s Apple TV or Google’s Drive and Workspace.
Low market share and growth mean lower profits. This usually reflects poor quality, marketing, and high prices.
These are the rising market leader due to high demand and increasing popularity. Stars can make large profits but require heavy investments due to high market growth. Growing markets means more demand and more competition. To rise above the competition, stars need solid support and major resources.
When growth slows, rising stars that have maintained market superiority become cash cows.
They are kings of a market and, thus, produce money in excess. Their markets are stable; thus, cash cows do not need major investments. Profit margins are high, and cash flows are strong. However, innovation is necessary to maintain a major market share.
Do note that the BCG matrix can only prescribe, not predict. It tells companies what decisions to make, where to invest & divest, etc. but does not tell anything about what might happen. The matrix also does not consider any rapid market changes or major disruptions.
To go through different BCG matrices based on company examples, look at the examples section of this guide.
Once created, it is important to understand exactly what the matrix shows.

The idea and logic behind the matrix are simple – businesses that lead a market rake in bigger bucks. They gain a cost advantage over rivals and, thus, enjoy a huge market share. This automatically leads to high growth potential.
Relative market share and the growth rate are two key indicators that reveal two of the most important investment factors – competitiveness and market attractiveness.
Products or businesses that grab a large market share before growth slows down become cash cows. To do so, it must provide higher quality-to-cost ratios than its rivals. If it can grab the lion’s market share before growth slows down, it can become a cash cow.
Realistically, growth in any business sector is bound to slow down as the market saturates. Businesses should aim to turn their stars and question marks into cash cows. Cash cows provide the money to turn question marks into stars &, eventually, into newer cash cows.
It is time we looked at how to create a BCG matrix.
Studying business or management can often be challenging. And the difficulty increases even more when you have to write flawless papers on the BCG matrix. No worries. Refer to our clearly illustrated BCG matrix examples to enhance your understanding and solve complicated problems accurately.
To create a BCG Growth-Share matrix, a company needs to do careful market research and analyses all its products, services, subsidiaries, etc. How is a product performing? How does it compare to the competition? What is the consumer perception?
Armed with all such information, a company should start working on the framework using the following steps. Below is an example of a BCG matrix process.
Pick the product or service to be checked.
The major rivals, the factors affecting the growth rate, the trends, market size, market features, the nature of consumers, the economics, etc. – all these market aspects are vital. In-depth market analysis is THE MOST crucial part of this process. Wrongly defined markets will lead to grossly incorrect results.
Detailed market research and analysis are the only to make accurate decisions.
Market analyses will reveal how much a product’s share compares to others. There’s a formula that shows market share relative to the largest competitor
Relative Market Share = (Product Market Share Percentage / Largest Rival Market Share Percentage) * 100
To find out the product market share percentage, the formula is
Product Market Share Percentage = (Product Revenue for a Business / Total Market Revenue) *100
The growth rate of a market is given by the following equation
((Current total market sales – Total market sales in the previous year) / Total sales in the previous year) *100
Use any BCG matrix template with an example, such as the ones at MyAssignmenthelp.com, to classify & place products.
Well, that was the gist of how to develop a BCG matrix. Now, let’s look at how businesses use this tool in real-life scenarios.
As may be intuitive, BCG matrices come in handy when a company needs to take stock & rejig its business structure. Complete market research & analyses of every offering reveal where each stands with respect to the other and the competitors. The BCG matrix then helps to segregate, prioritise, and make better decisions.
Here’s how Fortune 500 companies like Apple, Coca-Cola, Pepsi, and Google use BCG matrices.
Companies reduce investments if a product has been doing well for years and has become the market leader. Examples are Apple’s iPhone and Coca-Cola’s primary soft drink.
Markets are ever-changing. And so are consumer preferences. For the best results, a company must routinely conduct thorough market analyses and revise their BCG matrices. Though effective, BCG matrices do have drawbacks.
We wrap things up with our expert BCG matrix analysis of Apple and Alphabet(Google), two of the richest companies in 2023.
Here are two examples of BCG matrix on these two tech giants.
Star iPhone is undoubtedly the rising star, the flagship product. The demand is high among the rich & elite, and honestly, there’s no consistent competition for the iPhone in its category. Yet, the luxury phone segment is quite a niche, and Samsung is always coming up with something to challenge Apple.
Cash Cows The Appel MacBook, the successor of the hugely successful Apple Computer, is widely recognised and sells. It is a leader in the laptop market.
Question Marks Digital television is a fast-expanding domain but has major competitors. The Apple TV is not a market leader, sells low, and has stiff competition from Amazon Fire Stick and Google Chromecast.
Pets The iPad, the once popular tablet, raked in lower amounts in fiscal year 2022 than in 2021. The tablet market itself has been in a steady decline even before the 2020 Covid-19 pandemic.
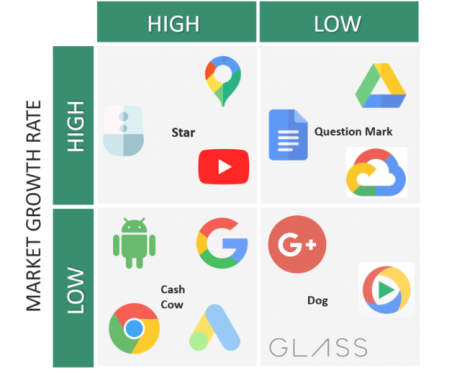
Cash Cows Google Search, Android OS, Google Chrome, and Google Advertising dominate their respective markets. These alone have consumed most of the market share and driven it to saturation. If all else fails, Google Search will still keep Alphabet as one of the tech giants.
Stars YouTube was already a cash cow and a leader in the online streaming market. The rise of streaming services like NetFlix, Amazon Prime, Disney+, etc. rejuvenated the market and increased opportunities. Competition increased, but YouTube is still the winner in streaming content.
Google Assistant is going toe-to-toe with the like of Amazon’s Alexa, Apple’s Siri, and Microsoft’s Cortana.
Question Marks Google Drive and Workspace reap the benefits of a growing market for digital workspace. But, Microsoft 365, Slack, Dropbox, and Zoom hold major portions of the market share.
Pets Google Plus, Google Glass, and the age-old Google Video Player never took off. Google + was Google’s answer to Facebook; it raised more questions about Google’s ideas & strategies for social networking & a behemoth like Facebook.
And that finally brings us to the end of this write-up. Here’s hoping this was an interesting and informative read for everyone.
Go through the well-researched BCG matrix on Starbucks, Coca-Cola, Microsoft, General Motors, Amazon, Hyundai, etc., here at MyAssignmenthelp.com. And, if you need some expert help while working on the BCG matrix assignment, connect with us anytime!
Call, mail, or drop a message at our live chat portal.
Ans: The BCG matrix is an example of a business planning and prescriptive portfolio management tool.
Ans: The four categories are Stars, Cash Cows, Question Marks, and Pets.
Ans: The BCG matrix is a great way for investors to determine where and how to invest.
Ans: BCG is an acronym for Boston Consulting Group Inc., one of the USA’s oldest global management consulting firms.
Ans: The matrix requires companies to do deep market research & analysis. It then helps companies conduct a comparative analysis of their product portfolios, judging market growth & determining market share concerning the biggest competitors.
Ans: Cash cows are established market leaders that generate continual, heavy cash flows. They act as continual sources of steady cash flow for a company and do not consume many resources.
Ans: The steps to write a BCG matrix are as follows:
Ans: The market growth rate is the percentage by which a market has grown in a specific time period

Hi, my name is Lucy Wilson. I am 26, a successful digital marketer, lifestyle blogger, and a Literature writing expert based in Melbourne. I have loved social media and writing since my teenage days. I am a certified digital marketer with a Masters degree in Literature. Sounds quite wierd? Well, that’s because I can’t be less or more enthusiastic about either of my passions. Additionally, I work part-time as a writing expert for myassignmenthelp.com. When I am not working, I am probably partying with my friends or listening to my kind of music or simply lazing around.
