
Why did Apple's revenue increase despite a decrease in quantity sold?
1.Explain intuitively why Apple’s revenue has increased after the average sale price increase, even though the quantity sold fell.
2.Given that the average sale price of an iPhone increased from $694 in Q1 2017 to $796 in Q1 2018 (Gartenberg, 2018), calculate the price elasticity of demand for Apple iPhones.
3.Draw a representative demand curve for Apple iPhones, which is consistent with your answer to part ii above. Label each relevant point on your diagram and give it a heading. Explain your diagram fully, including discussion (linked to the points indicated in your diagram) about price, quantity and revenue, and how the diagram illustrates/fits in with your answer to part i. Note, only one demand curve is required – treat iPhones as one good, rather than looking separately at iPhone X and iPhone 8, using the average sale price.
4.Now assume that Samsung brings out a competing model to the iPhone X. Redraw your diagram from part iii, and work further on it to Illustrate this scenario. Assume that the supply curve for iPhones is a standard, upward sloping curve and clearly indicate any changes to demand, supply, quantity demanded and/or quantity supplied.
1.Apple has charged higher price for iPhone X compare to iPhone 8, while the quantity sold for the initial product has decreased. This can be explained with the help of economic concept. Total revenue can be obtained by multiplying total quantity sold in the market with per unit price of the one. By comparing total revue obtained from iPhone 8 and iPhone X, it can be stated that change in price is comparatively high compare to change in quantity demanded (Tian et al. 2017). Hence, increase in price for unit phone has helped the company to increase its total revenue. This can be explained as follows:
Total revenue (TRX) = total quantity of iPhone X (QX) * per unit price of iPhone X (PX)
Total revenue (TR8) = total quantity of iPhone X (Q8) * per unit price of iPhone (P8)
Here, QX < Q8 while P8 > PX.
2.Price elasticity related to demand measures the responsiveness of quantity demanded for a particular product when its price changes (Coglianese, Davis, Kilian and Stock 2017). The average sale price of iPhone has increased from $ 694 to $ 796 while the quantity has decreased from 78.29 million to 77.32 million. Hence, initial price = $ 694 and change in price = $ (796-694) = $ 102. On the other side, initial quantity demanded is 78.29 million and change in quantity demanded is (77.32- 78.29) million = - 0.97 million. Thus, Price elasticity of Apple iPhone is: (Ep) = - (0.97/78.29) * 100 / (102/694) * 100
Calculating the price elasticity of demand for Apple iPhones
Ep = - 0.08
Hence, the absolute value of price elasticity of demand for iPhone X is 0.08.
3.
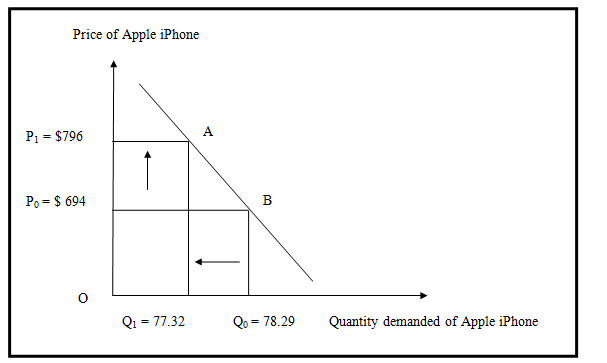
Figure 1: Demand curve for Apple iPhone
Source: (created by author)
In figure 1, the demand curve for Apple iPhone is drawn. As the absolute value of price elasticity of Apple iPhone is 0.8, this implies inelastic demand where the product has steeper demand curve with negative slop. This in turn has implied that change in price is high comparing to the change in quantity demanded (Halcoussis, Lowenberg and Roof 2017). This implication has also drawn on the above figure, where difference between two prices are more compare to the difference between the two amount of quantity demanded.
Here, the rectangular area of P0BQ0O has represented the initial amount of revenue of the Apple company while area of P1AQ1O has represented the amount of revenue when price has increased and demand for iPhone has decreased accordingly. By comparing the value of these two areas it can be stated that the value of P1AQ1O is greater compare to the area of P0BQ0O, which in turn has helped the company to earn more revenue though the increment of price.
4.

Figure 2: Sift of demand curve of Apple iPhone
Source: (created by author)
Samsung has brought a product in market to compete with iPhone of Apple and consequently can be acted as the substitute product of Apple. Hence, an increase in price of Apple can decrease its demand, which in turn can increase the demand for Samsung in market. This is shown in figure 2 (Kaiser, U., Mendez, S.J., Rønde and Ullrich 2014). As Samsung has launched its product, the demand for Apple’s iPhone has decreased from Q0 to Q1 while the market price of this product has also decreased from P0 to P1, while the supply of iPhone has remained at a stable position. Consequently, the revenue of Apple can be decreased further.
References:
Coglianese, J., Davis, L.W., Kilian, L. and Stock, J.H., 2017. Anticipation, tax avoidance, and the price elasticity of gasoline demand. Journal of Applied Econometrics, 32(1), pp.1-15.
Halcoussis, D., Lowenberg, A.D. and Roof, Z., 2017. Estimating the Price Elasticity of Demand for Cannabis: A Geographical and Crowdsourced Approach. Revista de Métodos Cuantitativos para la Economía y la Empresa, 23, p.119.
Kaiser, U., Mendez, S.J., Rønde, T. and Ullrich, H., 2014. Regulation of pharmaceutical prices: evidence from a reference price reform in Denmark. Journal of health economics, 36, pp.174-187.
Tian, R., Zhang, Q., Wang, G., Li, H., Chen, S., Li, Y. and Tian, Y., 2017. Study on the promotion of natural gas-fired electricity with energy market reform in China using a dynamic game-theoretic model. Applied Energy, 185, pp.1832-1839.
To export a reference to this article please select a referencing stye below:
My Assignment Help. (2019). Understanding Apple's Revenue Increase And Price Elasticity Of Demand For IPhones, An Essay.. Retrieved from https://myassignmenthelp.com/free-samples/price-elasticity-of-demand-for-iphone.
"Understanding Apple's Revenue Increase And Price Elasticity Of Demand For IPhones, An Essay.." My Assignment Help, 2019, https://myassignmenthelp.com/free-samples/price-elasticity-of-demand-for-iphone.
My Assignment Help (2019) Understanding Apple's Revenue Increase And Price Elasticity Of Demand For IPhones, An Essay. [Online]. Available from: https://myassignmenthelp.com/free-samples/price-elasticity-of-demand-for-iphone
[Accessed 15 July 2026].
My Assignment Help. 'Understanding Apple's Revenue Increase And Price Elasticity Of Demand For IPhones, An Essay.' (My Assignment Help, 2019) <https://myassignmenthelp.com/free-samples/price-elasticity-of-demand-for-iphone> accessed 15 July 2026.
My Assignment Help. Understanding Apple's Revenue Increase And Price Elasticity Of Demand For IPhones, An Essay. [Internet]. My Assignment Help. 2019 [cited 15 July 2026]. Available from: https://myassignmenthelp.com/free-samples/price-elasticity-of-demand-for-iphone.
