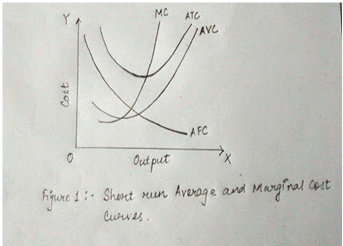
Average Total Cost (ATC) = Average Fixed Cost + Average Variable Cost.
Therefore, we know that Short run Average total cost is a sum of average fixed cost (AFC) and average variable cost (AVC).
AVC curve is U in shape, and it is related to the law of variable proportions. When there is an increasing level of output, AVC curve is sloped positively, in this case extra units are added to the fixed inputs. Average variable costs falls till the optimum output level due to increasing returns and increases after that as returns diminishes to the variable factors.
AFC curve forms a shape of rectangular hyperbola, asymptotic to the axes. Total fixed cost is positive hence cannot be zero. So even if it approaches to the X axis but never touches it. It approaches to Y axis but do not touch it as well as it has positive outcome even if the output level is low.
Marginal cost curve is U-shaped because of the law of variable proportion. Increasing returns to a factor lead the curve to be negatively sloped at first thereafter for decreasing returns it is positively sloped.
The resultant ATC is U in shape, initially AVC and AFC both are falling and so ATC is falling. When falling AFC> rising AVC, ATC continues to fall. Then falling AFC< rising AVC hence ATC starts rising. Thus, the curve initially falls and then rises. (pohnpei397, 2011) (Studies, 2007)

Economies of scale refer to a situation when the cost per unit decreases due to increase in the units of production. When a firm increases its production or expands its business and starts producing efficiently, a greater amount of output is expected with a lower amount of average cost, and in these way economies of scale is achieved. For example, ABC Limited produces 5 units and cost of production is $20. Then cost per unit stands $4 per unit. If production increases to 10 units with the same cost of production then cost per unit would be $2 per unit. This relates to economies of scale. Now, as per the law of diminishing returns, the production increases and the cost per unit decreases there would come a certain point of time when marginal cost per unit would start to decrease. There are other factors like labour, capital. Considering a laborer when he is taken on a service he produces 25 units and the second person produces an extra 10 units of output, then the third person extra 5 units, the fourth person extra 4 units and so on. In this way the additional return produced by the laborers are decreasing and diminishing return or diminishing marginal return is taking place. The concepts of economies of scale and diminishing return both talks about the business expansion of a firm by increasing its production size. (Wells, 2012)
The model assumes that the products which are bought and sold in the market are homogeneous, buyers and sellers have full details or information about the market and the product, free entry and exit is possible, firms are price takers and they have lower market share. But practically, a product may be somewhat different from one to another. It is impracticable to have all buyers and sellers who know vividly about the market or product. For these it is said to have little practical value.(Stengel, 2014)
Economies of Scale
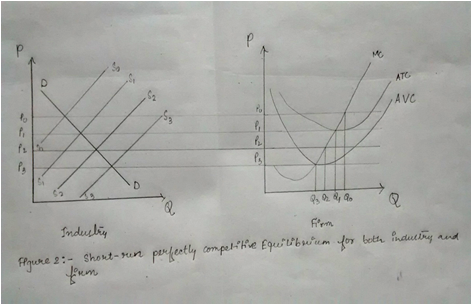
In the diagram the short run perfectly competitive market has been described with the help of short run cost curves with the demand curve When price= Po the firm enjoys a supernormal profit as Po>ATC (Average total cost). At P1, it earns a normal profit. P2 is greater than average variable cost; a portion of fixed cost is covered. P3 is equal to AVC (minimum) the firm may stop production or supply output in this case. The firm equates price to MC and takes decision on the quantity to be supplied so long Price is greater than average variable cost. (D.K. Sethi, 2008)

In long run the industry neither expands nor shrinks its production. The industry is at minimum point of long term average cost curve and market demand would be equal with the supply. The equilibrium point shall be the point of intersection between demand and supply curve (i.e. E) in the diagram. No entry or exit or price change would take place. (D.K. Sethi, 2008)

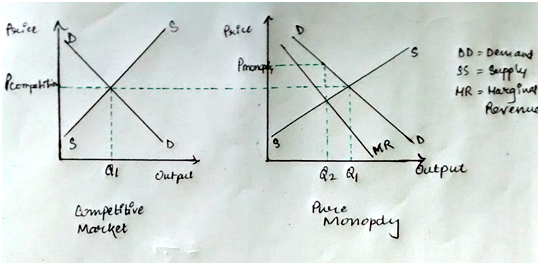
In case of a monopoly market, it is presumed that price will be higher than average cost and marginal cost, because of this loss in the allocative efficiency is identified. It is such a situation when high prices are charged, without utilization of resources optimally. The same is seen when government intervenes through deregulation or competition policy in the market.

X inefficiency is also a notable inefficiency in monopoly market which relates to a situation when no real cost savings will be achieved under pure monopoly as compared to competitive market. In the diagram, at PMon, consumer surplus is reduced, as higher price is charged by the monopolists with the same output, for which social welfare decreases. The triangle ADB is a measure of the cost of social welfare or the dead loss suffered. (Leibenstein, 1966)

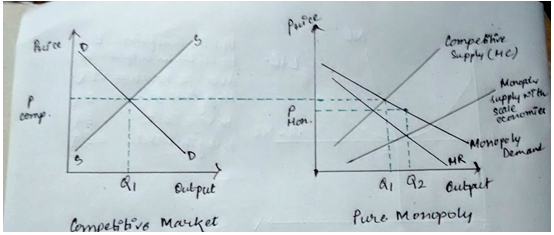
A benefit of economies of scale is seen under monopoly market. In the diagram it is assumed that in the long run, marginal cost is lower, equilibrium output is Q2, the price is less than the competitive market. (D.K. Sethi, 2008)

In Australia, several governmental policies have been introduced and modified with the introduction of microeconomic reforms. In the product market, reform has been introduced and barriers to enter in to the market were removed and guidelines have been modified. In 1985, a change was seen in finance industry and in 1987 it was seen in aviation industry. International financial institutions were allowed in the market and in aviation industry, parallel import legislation restrictions were modified. Removal of tariff protection, reforms relating to privatization, tax related reforms are other examples.
The microeconomic reforms were introduced in such a way that it improves the quality of the products or services, optimum allocation of resources, and with the initiation of these reforms a company would achieve economic growth. The reforms were positively impacted the Australian market. (Borland, 2001)There might have been a significant portion of cost involved with the reform, excess of which might have created a negative scenario. In domestic aviation industry, prices decreased and passengers were increased by 75% approximately, employment increased in 1996 by 19% from the year 1990 after the two airline policy was initiated in the year 1990. The privatization or corporatization of electric industry has also shown a notable change in decreasing the cost per unit. (Quiggin)
Borland, J. (2001). Microeconomic reform in Australia – An introduction . Microeconomic reform in Australia – An introduction , 1-5.
D.K. Sethi, M. U. (2008). Frank ISC Economics. Noida: Frank House.
Leibenstein, H. (1966). Allocative Efficiency vs X efficiency. In H. Leibenstein, The American Economic Review (pp. 392-415). American Economic Association.
pohnpei397. (2011). Why is the average cost curve u-shaped? eNotes , 1.
Quiggin, J. (n.d.). Economic Governance and Microeconomic Reform. Economic Governance and Microeconomic Reform , 14-17.
Stengel, D. N. (2014). Principles of Managerial Economics, v. 1.0:Assumptions of the Perfect Competition Model. Flat World Education, Inc.
Studies, B. o. (2007). General Economics. Noida: Dr T P Ghosh, The Institute of Chartered Accountants of India.
Wells, K. (2012). Law of Diminishing Returns: Definition, Examples & Quiz. Education Portal , 1-3.
To export a reference to this article please select a referencing stye below:
My Assignment Help. (2015). Understanding Short Run Average Total Cost, Economies Of Scale, And Microeconomic Reforms In Australia. Retrieved from https://myassignmenthelp.com/free-samples/different-types-of-cost-curves-and-concept-of-economics-of-scale.
"Understanding Short Run Average Total Cost, Economies Of Scale, And Microeconomic Reforms In Australia." My Assignment Help, 2015, https://myassignmenthelp.com/free-samples/different-types-of-cost-curves-and-concept-of-economics-of-scale.
My Assignment Help (2015) Understanding Short Run Average Total Cost, Economies Of Scale, And Microeconomic Reforms In Australia [Online]. Available from: https://myassignmenthelp.com/free-samples/different-types-of-cost-curves-and-concept-of-economics-of-scale
[Accessed 20 May 2025].
My Assignment Help. 'Understanding Short Run Average Total Cost, Economies Of Scale, And Microeconomic Reforms In Australia' (My Assignment Help, 2015) <https://myassignmenthelp.com/free-samples/different-types-of-cost-curves-and-concept-of-economics-of-scale> accessed 20 May 2025.
My Assignment Help. Understanding Short Run Average Total Cost, Economies Of Scale, And Microeconomic Reforms In Australia [Internet]. My Assignment Help. 2015 [cited 20 May 2025]. Available from: https://myassignmenthelp.com/free-samples/different-types-of-cost-curves-and-concept-of-economics-of-scale.
