
Equilibrium Price and Quantity in a Perfectly Competitive Market
The demand for wheat in a country is QD = 200−2P, and supply is QS = −20 + 2P, where P is price in pounds and Q is quantity in tonnes.
(a) Find the no-trade equilibrium price and quantity in the market. What are the values of consumer and producer surplus in equilibrium?
(b) The government decides to open the domestic market to imports. The world price of wheat is £20 per tonne. In order to safeguard farming the government sets a tariff of £20 per tonne. Illustrate on a diagram and calculate the government’s revenue from the tariff.
(c) Calculate the new consumer surplus and producer surplus under (b). By how much is society better off than under (a) above? Comment on the implications for the distribution of income between farmers and consumers if the tariff revenue is given to farmers as a lump sum payment.
Does The Intricacy of The Topic Intimidate You?
Tame Your Fear with Unmatched Assignment Help Services from Professional Writers
(a). Qd= Qs
200 2P = -20 + 2P
P= 55
Substituting P in Q, we get Q= -20+ 110= 90
Thus, at no trade, the equilibrium price and quantity is 55 and 90 respectively.
(b).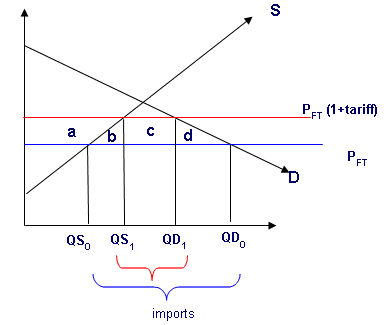
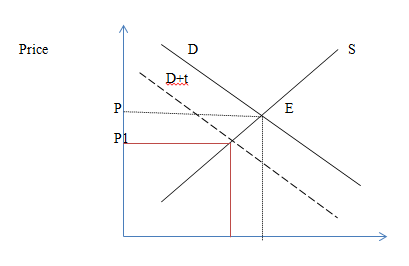
If the government imposes a tariff on the world price in order to safeguard the fsrmers, the government revenus from the tariff is depicted by the region c which was the pasrt of the consumer surplus earlier but due to the imposition of tariffs, there has been rise in the revenue of the government depicted by region c.
(c). Due to the imposition of the tariffs there has been loss in the consumer surplus and gain in the producer surplus . Consumer loss the area of a+b+c+d whereas the producer surplus increased from the area which is a+b. Overall, there have been the dead weight loss shown by the area b+d which is calculated by considering the gain in producers surplus, loss in the consumer surplus and gain in the tax revenue. If the given tariff is distributed among the farmers and consumers there will be overall rise in the economic surplus.
Discuss the following questions and substantiate your arguments with economic theory. Clearly state which assumptions you make in answering the questions. Make use of diagrams where appropriate.
(a) You are charged with maximising governmental revenues from cigarette taxation. What kind of tax rate do you propose and why? Is it possible that you would advise the government to reduce the tax rate? Why or why not?
(b) Discuss possible reasons why a government that wants to increase tax revenues would like to tax cigarettes at all. Are there other goods you think that revenue-maximising governments would like to tax? Why?
(c) How would your answer to (a) change if in addition to generating revenues, the government would also like to make people healthier?
(a) Being an in charge to the government to maximize tax revenue from cigarette one can propose the high proportional tax rate on products like cigarette and can also suggest to raise up to certain level because the smokers get habituated to cigarette and it is very difficult to reduce its consumption.
Maximizing Government Revenue from Cigarette Taxation
(b) The government wants to levy a tax on cigarette due to following reasons:
- Government wants to curb the consumption of cigarette due to its harmful impacts on human health.
- Demand for cigarette is less elastic and thus generate higher revenue for government.
These are the most important reasons why government impose tax on such products. Other goods of similar class like alcohol, tobacco, guthka and pan masala are taxed heavily due the above mentioned reasons.
(c) If government wants to fulfill twin objectives of higher revenue along with healthier people, one can suggest substantially high proportional tax rate which can lead to a reduction in expenditure on cigarette and similar products and also fetch more revenue for government.
In a perfectly competitive market, the demand curve is QD = 120−3P and the supply curve is QS = 2P, where QD is the quantity demanded, QS is the quantity supplied, and P is the price
(a) Find the equilibrium price and quantity. Calculate consumer and producer surplus in this market.
(b) The government now introduces a tax of T = 10 per unit sold, so that the supply curve now becomes QS = 2(P − T), where P is the price paid by consumers. Calculate the government’s revenue from the tax.
(c) Find the deadweight loss associated with the tax. How else could the government in this example raise the same tax revenue, without incurring any deadweight loss?
(a)
Qd = 120-3P, Qs = 2P
At equilibrium à Qd = Qs equilibrium price and demand (P = 24, Qd = Qs = 48)
Consumer’s surplus = ) – 24*48
=[40Q Q – Q^2/6 ] - 1152 = 384
Producer’s surplus = ) = 576
(b)
Qs = 2(P-t) { t= tax}
Qs = 2(P-10) à 2P -20 =Qd =120-3P
P = 28, Qd = Qs =36
Tax Revenue = Quantity* tax rate = 36*10=360
After Tax
Consumer’s surplus = ) dQ – 28*36
=[40Q Q – Q^2/6 ] - 1008 = 216
Producer’s surplus = ) dQ
= 1008-[10Q+Q^2/4]
= 324
(c)
Total benefit before tax = C.S + P.S + Tax Revenue = 384+576+0.0=960
Total benefit after tax = C.S + P.S + Tax Revenue = 216+324+360=900
Dead weight loss=60
In a competitive market, market demand is qd = 104 − 16p, where qd denotes the quantity demanded and p is the price. Market supply is qs = 8p−16, where qs denotes the quantity supplied.
(a) Explain why at the equilibrium it must be true that demand equals supply. Calculate the equilibrium price and quantity in the market. Show your result diagrammatically.
(b) Explain the concepts of consumer and producer surplus. Use your results in (a) to calculate producer and consumer surplus in this economy.
(c) Now suppose the government introduces a speciï¬Âc tax, t = 3 paid by the suppliers. Find the new equilibrium price and quantity in the market and compare your result to your result in (a). Show your result diagrammatically.
(d) Using a diagram to illustrate your answer, explain how the introduction of a speciï¬Âc tax creates a deadweight loss in the market. Explain how this deadweight loss depends on the elasticity of demand.
Reasons for Taxing Cigarettes and Other Goods
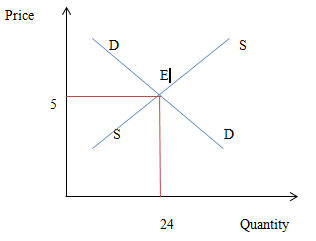
(a) The equilibrium price of a commodity is estimated by intersecting the two curves, demand curve and supply curve. At the equilibrium price, the quantity demanded equals quantity supplied. In other words, the amount demanded at this price by the consumers is equal to the amount supplied by the producers. Thus, the market is in equilibrium and hence the market is cleared at this equilibrium price. There is no shortage or surplus at this equilibrium price. That is why; demand always equals supply at equilibrium price.
Here, it is given that, Quantity demanded= 104 – 16p ........................................................(1)
Quantity supplied = 8p – 16...............................................................(2)
As we know, at equilibrium, Quantity demanded= Quantity supplied
Therefore, 104 – 16P = 8P – 16
104 +16 = 8P + 16P
P = 120 / 24 = 5
Substituting the value of P in (2), we get Q= 40- 16= 24.
Hence, the equilibrium price is 5 and equilibrium quantity is 24.
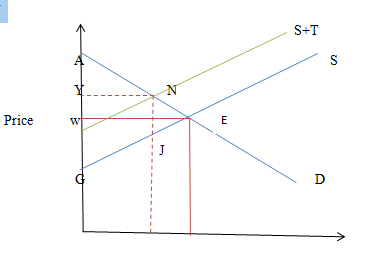
(b). Consumer surplus is the difference between the price a consumer is willing to pay and what he actually pays. This happens when a consumer is willing to pay more than the current market price for a good or service. Consumer surplus is shown in the area above the market price and below the demand curve. Whereas, producer surplus is the difference between the amount the producer is willing and able to supply good for and the amount they actually receive. It is shown as the area above the supply curve and below the market price.
Using the results found in (a), we find that the equilibrium price is 5 and the equilibrium quantity is 24. It implies the maximum amount of units the consumer will be willing to purchase at this price. Using the demand equation, y intercept shows the intercept price so maximum price when the quantity demanded is zero equals
Q= 104 – 16P
104 – Q = 16 P
6.5 – Q/16 = P
If the demand equation is 6.5 – Q/16 = P , then the y-intercept price is 6.5.Using the maximum price of 6.5 as the height and the maximum units purchased 24 as the base, the consumer surplus in this market would be: 1/2 x (6.5-5) x 24= 18. The consumers receive a surplus of 18 in this economy.
Producer’s surplus is 0 in case of perfect competitive economy.
(c). As the government imposes a tax =3on suppliers, the new supply equation becomes
Quantity supplied = 8(p-3)- 16= 8P- 24-16= 8P-40
To find new equilibrium price, we again equate demand equation with the new supply equation
Quantity supplied = 8P – 40 and Quantity demanded= 104 – 16p
8p – 40 = 104 – 16p
24 P= 144
P= 6
Substituting the new price in demand equation, we get new equilibrium quantity becomes 8.Hence due to the imposition of the tax, equilibrium price increases and equilibrium quantity decreases.
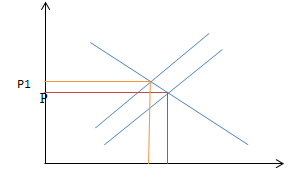
As we see from the graph, due to imposition of tax, supply falls due to which there is a fall in the equilibrium quantity and rise in the equilibrium price.
Impacts of Imposing Tax on Cigarettes in a Competitive Market
(d).
Q1 Q Quantity
As we see from the above diagram, before the imposition of tax, consumer surplus was AWE and the producer surplus is WEG. Due to the imposition of specific tax, supply curve shifts upward by the amount of tax imposed, T. This leads to fall in the consumer surplus from AWE to AYN and NEJ is the dead weight loss.
Assume that the UK changes planning regulations to the extent that it becomes easier to build new houses. Making use of economic theory and diagrams where appropriate, discuss the effect of this regulatory change on the following:
(a) The price of houses for ï¬Ârst-time buyers. Clearly state any assumptions you make in your answer.
(b) The demand for country houses adjacent to new housing developments. Clearly state any assumptions you make in your answer.
(c) Does your answer to (b) depend on whether new houses are accompanied by better infrastructure (e.g., shops, road, schools, etc.)? Clearly state any assumptions you make in your answer.
(a). Since it has become easier for the buyers to purchase a new house, there will be a sudden increase in the demand for the houses. It is assumed here that the buyers do not own any houses before. The marginal utility of the buyers will be high. With the introduction of the new regulation, supply will also increase and hence the price may come down. Here, it is assumed that people are buying house for the first time.
(b). The demand for the houses near housing development will be more because these are key factors that a person looks for before buying a house. He makes sure that the basic and daily needs are near to him. Also, it makes a society more desirable to be lived in. And hence the prices of such places are more. Here we assume the trickle down effect.
(c).Yes buying a house depends on whether there is a better infrastructure or not. Any buyer would take note of these before purchasing a house. He may compromise little bit on the magnitude of the infrastructure but he would make sure that there is basic infrastructure available wherever he is purchasing a house. He would buy the best house with the maximum possible infrastructure within his budget.Here, we assume that he buys a best house considering the basic infrastructure and his budget. His budget of buying a house is a constraint.
Consider a consumer with utility function U(x,y) = 2x + y. The price of good x is px = 10, which is identical to the price of good y, py = 10. The total income of the consumer is given by M = 500.
(a) Derive the Marginal Rate of Substitution between goods x and y and solve for the optimal consumption bundle.
(b) Show the solution in a graph. What level of utility is the consumer going to achieve with this bundle?
(c) Now assume that the price of good y decreases to 5. Find the new optimal consumption bundle and comment on it.
U(x,y)= 2x+y
Px= Py= 100
M= 500
(a) MRs= Mux / MUy= 2/1= 2
In equilibrium, Px= Py
X= 50 ; if Px> Py
0; if Px<Py
0<x< 50 ; Px= Py
Same for Y
(b) There is no income effect. There is full substititution effect. With the reduction in the price of Y, consumer substitute good X with good Y.
(c) In equilibrium, consumer can buy any quantity of good X and Y . That is, 0 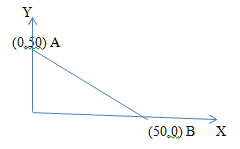
Any bundle (x,y) i.e. 0< (x)< 50and 0< (y-x)< 50 is possible.
Py= 5
Therefore, Py<Px, hence consumer will buy good Y only. Optimum point is A(0,50)
Jim has an income of £100 which he spends on two goods, beer and pizza. The price of beer is £2 per unit and the price of pizza is £2 per unit. Assume that Jim behaves optimally.
(a) Write down Jim’s budget constraint. Draw a diagram of Jim’s budget line with pizza on the horizontal axis. Jim consumes 30 pizzas. How many beers does he consume?
(b) Now the price of pizza falls to £1 per unit and Jim consumes 50 pizzas. The price of beer and Jim’s income are unchanged. Jim tells us that with the pizza price at £1 he would be just as well off as he was originally (under (a) above) if he had an income of £70, in which case he would consume 40 pizzas. Use this information to calculate the substitution and income effects of the fall in the price of pizza from £2 to £1.
(c) Is beer a normal good for Jim? Explain.
(a). 2P + 2B = 100
2(30) + 2 B= 100
2B= 40
B= 20
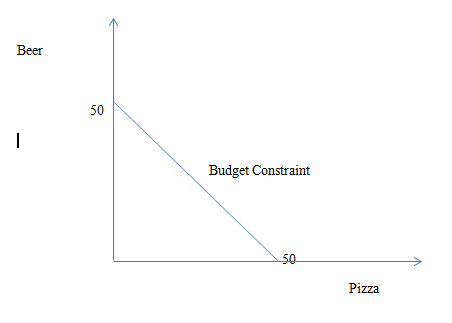 In order to find the maximum pizza Jim can buy when he buys none of the beer is 2P+0 = 100, P=50. Thus, he can buy 50 pizzas.
In order to find the maximum beer Jim can buy when he buys none of the pizza is 2B+0 = 100, P=50. Thus, he can buy 50 beers.
(b). Due to fall in price of Pizza by $1, the consumer consumes 40 pizzas and reduces the consumption of beer to 15 when his income is 70.
(c). Beer is a normal good as the demand of it is directly dependent on the income.
John’s utility function is given as: U(x,y) = xy, where x and y denote the quantities of goods x and y he consumes. His budget constraint is: 4x + 8y = 120, where 4 is the price of good x, 8 is the price of good y and 120 is his income.
(a) From the utility function ï¬Ând the expression of the Marginal Rate of Substitution for John. Find the typical equation of an Indifference Curve for John.
(b) Find the optimal quantities for x and y consumed by John. Show your solution diagrammatically.
(c) John’s friend Anne has exactly the same income as John. However, Anne’s utility function is U(x,y) = x 1 3 y 2 3 . Find the equation of Anne’s Marginal Rate of Substitution and her optimal consumption bundle.
(d) Compare the optimal bundles of John and Anne. Discuss.
(a) U(x,y)= xy
Budget constraint 4x+8y=120
MR = du/dx
du/dy
MRS = y/x
(b) In equation MRS=Px/Py
y/x = 4/8
2y=x
4x + 8y =120
4(2y) + 8y = 120
Y=7.5
X= 15
(c) U= x1/3 y2/3
MRS= (1/3x-2/3 y2/3)/2/3 x1/3 y-1/3
MRS= y/2x
Y=x
X*= a M/( a+b ) Px = 120/12 =10 where a=1/3, a+b=1, M=120,& Px=4
( a+b ) Px
X*= 10
Y*= 10
d) John optimal bundle X= 15 Y=7.5 Anne optimal bundle X= 10 Y=10
John is better of for x than Anne while Anne is better off for y than John
Discuss the following statements making use of consumer theory. In your answers, clearly state any assumptions you make and substantiate your claims with economic theory. Make use of diagrams where appropriate.
(a) Consumer theory cannot explain why water is cheaper than diamonds, because obviously people get much more utility from water than from diamonds.
(b) You observe a consumer who invests part of his savings into a safe asset with a ï¬Âxed return of 4% and part into a risky asset that gives him either 0% or 10% return with equal probability. If the returns of the risky asset increase to 2% and 12% (with equal probability) respectively, you will observe that the consumer now chooses to invest more in the risky asset than before.
(a) Consumer theory cannot explain why water is cheaper than diamonds even though the utility derived from water is very high because economics studies some that is not freely available and not scarce. Anything that is scares and commands price comes under the domain of economics or consumer theory.
(b) The consumer would beinterested in investing in risky assets rather than safe assets because he would any way get 2 percent minimum even if it looses. Bot if it gains, the gains will be quite large. They are ready to take for that extra 2 percent which may give them the chance to earn higher returns if they gain.
Consider a perfectly competitive market for a given good. Assume that the market demand is given by qD = 210−3p, where qD is the quantity demanded and p is the price. The market supply is qS = −10 + 2p, where qS is the quantity supplied.
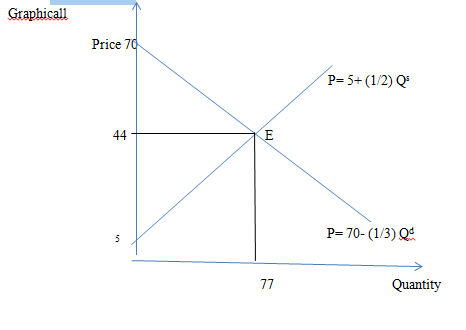
(a) Find the equilibrium price and quantity in the market. Show the equilibrium in a graph by plotting the inverse demand and supply functions.
(b) Explain the concepts of producer and consumer surplus. Using your results in part (a), calculate the consumers’ surplus, the producers’ surplus and total surplus in the economy.
(c) Now assume that the government introduces a price cap in the market of pcap = 30. Find the new equilibrium quantities supplied and demanded under this price cap, as well as consumer, producer, and total surplus. Show your result graphically.
(d) Compare your result in (c) with your result in (b) and use this comparison to evaluate the introduction on the price cap.
(a) Given,
Quantity demanded = 210-3P
Quantity supplied = -10+2P
At equilibrium, Quantity demanded = Quantity supplied
Thus, 210-3P = -10+2P
5P= 220
P= 44
Substituting this in Quantity supplied = -10+2P, we get Q= 78
Thus, the equilibrium price is 44 and equilibrium quantity is 78.
Thus, the inverse demand function is
P= 70- (1/3) Qd
And, the inverse supply function is
P= 5+ (1/2) Qs
 (b). Consumer surplus is the difference between the price a consumer is willing to pay and what he actually pays. This happens when a consumer is willing to pay more than the current market price for a good or service. Consumer surplus is shown in the area above the market price and below the demand curve. Whereas, producer surplus is the difference between the amount the producer is willing and able to supply good for and the amount they actually receive. It isshown as the area above the supply curve and below the market price.
In the above diagram, Consumer surplus is ½ * (70-44)* 77= 1001
And producers’ surplus is zero as this is the perfectly competitive economy.
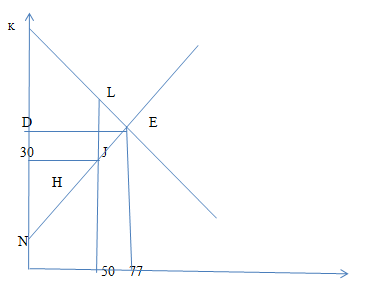
(C). Due to the introduction of the price cap of 30, the government wants to restrict any sales above 30. A price cap is effective only when it is set below equilibrium price. At this lower price, people would like to consume more but this may not happen as the sellers would not be willing to provide at this lower price.
Since Price cap is now 30, this will be the new equilibrium price and substituting this in the quantity supplied equation, P= 5+ (1/2) Qs , we get the new equilibrium quantity, 30= 5+ (1/2) Qs= 50.
There has been a fall in the producer’s surplus. The new producer surplus is H. The consumer surplus is KLJ30. Total Surplus is KLJN.
 QTY
QTY
(d). Due to the introduction of price cap, we see that there has been an increase in the consumer surplus and fall in the producers surplus. This price cap is found to be beneficial for the consumers and not good for the producers.
Consider a competitive market for a given good. The market demand is: qD = 20−2p, while the market supply is: qS = 3p−5.
(a) Find the equilibrium price and the equilibrium quantity. Sketch the equilibrium in a diagram.
(b) Now suppose that the government introduces a speciï¬Âc tax t = 2.5 in the market. Find the new equilibrium price and quantity after the tax is introduced. Show in a diagram the effects on the market equilibrium of introducing such a tax.
(c) Assume that demand instead is given by: qD = 15−p. The market supply is as before. Show that the equilibrium values of price and quantity before the introduction of the tax are as in (a), but that the equilibrium values after the tax introduction are not. Explain.
(d) Discuss the incidence of the tax under the two demand functions.
(a) Given,Quantity demanded = 20-2P
Quantity supplied = 3P-5
At equilibrium, Quantity demanded = Quantity supplied
Thus, 20-2P = 3P-5
5P= 25
P= 5
Substituting this in Quantity supplied = 3P-5, we get Q= 10
Thus, the equilibrium price is 5 and equilibrium quantity is 10.
(b). As the government introduces a specific tax t = 2:5 in the market, quantity demanded= 20-2(P+2.5)=15-2P
At equilibrium, Quantity demanded = Quantity supplied
Thus, 15-2P=3P-5
P= 4
Substituting this new value of equilibrium price in Quantity supplied = 3P-5, we get new equilibrium quantity is 7. As we can see due to the imposition of the tax, buyers are not willing to buy due to which there has been fall in the quantity demanded. And due to the fall in the quantity demanded, there ia reduction in the quantity demanded leading to the fall in the price
 Quantity
(c). Given new Qd = 15-p
Thus, Qd= Qs
15-p = = 3P-5
4p = 20
P= 5,
Substituting this in Qd = 15-p, we get equilibrium quantity Qd= 10. This is similar to the results found in (a).
After the tax imposition, the values for equilibrium price and quantity are not same because these depends upon the elasticity of the demand and supply curve which determines the slope of the curves.
(d). The incidence of the taxes depends upon the elasticity of the demand or supply curve. If the demand is inelastic, then the incidence will be on the buyers who have to bear the cost. If the demand is elastic, any rise in the taxes will lead to the fall in the demand so either it will be equally shared by the buyers or sellers or little more on the either party depending upon their respective bargaining power.
John earns £4 per hour and he has no non-labour income. He decides to work 30 hours per week.
(a) Show John’s utility maximising choice of leisure and his weekly income on a diagram.
(b) Now the government introduces a welfare system that provides a minimum lump-sum income of £80 per week. Draw John’s new budget line. Assuming that leisure is a normal good, will John work fewer hours under the welfare system? Explain.
(c) Instead of the lump-sum payment in (b), the government offers John an extra 50p per hour worked. Draw the new budget constraint. Assuming again that leisure is a normal good, will John work more or less than 30 hours per week? Explain.
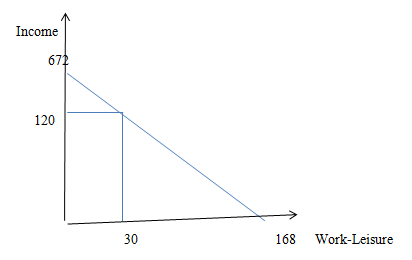
(a). Vertical axis plots income which is the wage rate times the amount of labour supplied. Here, it is 4* 168=£ 672 when the entire time is used in working. However, this is not the case in reality. People opt for leisure time and here they work for 30hours per week and hence generate an income of 4* 30=£ 120
Horizontal axis plots the maximum number of hours a labor can work in a week which is 168. Starting from point z, his leisure time is reduced by one hour and generates income equal to the wage rate.
 (b) Due to introduction of lump sum income of 80 , the budget line pivots outside as shown in the diagram below. Assuming leisure to be a normal good, its demand would increase due to the increase in the income. After a point, they would not like to work as they are getting sufficient income without doing extra work of 20 hours.
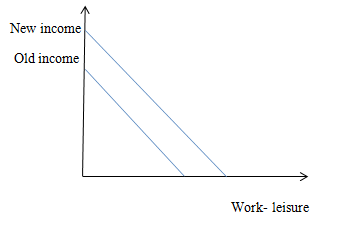
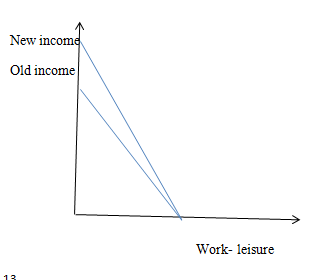
(d). Here, in this case, a person is earning extra income per hour so he will opt for working more number of hours to get the extra income. The new budget line for this case is shown below.
Are the following statements true or false? In each case, explain why they are true / false and discuss the impact of monetary and ï¬Âscal policy. Use diagrams and equations wherever it helps your arguments.
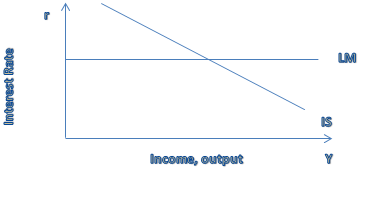
(a) If investment is not very sensitive to the interest rate, the IS curve is almost vertical.
(b) If money demand is not very sensitive to the interest rate, the LM curve is almost vertical.
(c) If the money demand is extremely sensitive to the interest rate, the LM curve is horizontal.
for a given change in interest rate there is marginal change in (no change) investments.
(a) In a case where investments are very interest rate inelastic.
In this case the IS curve is almost vertical. This is because as r decreases investments will increase by a small amount. Alternatively, a small increase in output will require a huge drop in interest rate.
(b) In a case where money demand is very interest rate inelastic
People do not want assets, as they do not trust them. In this case the LM curve is almost vertical. This is because as income (Y) increases money demand increases, so need a huge increase in interest rate to take money demand back to starting level.
(c) If money demand is extremely sensitive to the interest rate, then it takes a very small increase in the interest rate to reduce money demand and restore equilibrium in the money market. Hence, the LM curve is (nearly) horizontal, as shown in Figure below
Assume that the domestic demand for a good is QD = 100−P, and domestic supply is given by QS = 40 + P. The market for this good is perfectly competitive.
(a) Assume that the economy is closed. Calculate equilibrium price and quantity and show them in a graph.
(b) Assume that the economy opens to trade and that the world price for this good is £50. What are the equilibrium price and quantity in the domestic market? Show them in a graph.
(c) Calculate the consumer and the producer surplus in both (a) and (b). Compare them and discuss your ï¬Ândings, with special reference to whether it is beneï¬Âcial for the country to open to trade.
(a) Given
Quantity demanded = 100-P
Quantity supplied = 40+P
At equilibrium, Quantity demanded = Quantity supplied
Thus 100-P = 40+P
2P= 60
P= 30
Substituting this in Quantity supplied = 40+P, we get Q= 70
Thus, the equilibrium price is 30 and equilibrium quantity is 70.
(b) At world price, quantity demanded is lesser than the quantity supplied when compared to the domestic price.
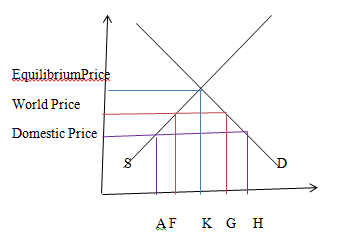
(c) As we see from the above graph that the consumer surplus is the highest followed by world price and domestic price in case of the equilibrium price which is the area above the price line and below the demand curve. Whereas, producer surplus is reduced after entering into the trade. It is the area below the price line and above the supply curve. Therefore, it is not beneficial to enter into trade.
Consider the following economy. Consumption, C, depends on income, Y , and private investment, I, is exogenous. There is no government:
C = 100 + 0.7Y
I = 40
This is an open economy, where imports, Z, increase with national income. Assume also that exports, X, increase with the national income, Y X, of the home country’s trading partner (the home country takes Y X as given):
Z = 10 + 0.1Y
X = 10 + 0.1Y X
(a) Write down the aggregate demand function for this economy and graph it in the Keynesian Cross.
(b) What is the equilibrium income of this economy? What value does it take if Y X = 100?
(c) Assume now that exports are described by X = 10 + 0.2Y X. Everything else remains unchanged. Calculate the new equilibrium income. How does this change affect the multiplier? Explain.
(a) Aggregate Demand= C + I + (X-M)
= [100+0.7Y] +40+ [X-M]
= 140 + 0.7Y + 10 + 0.1YX
Aggregate Demand= 140 + 0.6y + 0.1 YX
(b) Y= Aggregate Demand
= 140 + 0.6y + 0.1 [100]
0.4y= 150
Y= 375
- Aggregate Demand = 140 + 0.7Y +10 – 0.1y -10 + 0.2 YX
(c) Aggregate Demand = 140 + 0.6y + 0.2YX
Y= 140 + 0.2 (100)
Y = 400
When there is a change of 0.1 in marginal propensity to export e.g. now for a I unit change in YX it leads to 0.2 change in exports. Thus this leads to an increase in equilibrium income by 25.
The following questions deal with the IS−LM model of a closed economy and the concept of a “liquidity trap”:
(a) A liquidity trap is a scenario in which interest rates are very close to zero. Within the IS−LM model in which the nominal interest rate is equal to the real interest rate, discuss how such low interest rates relate to the willingness of people to hold money and to the elasticity of the LM curve. Draw the IS −LM equilibrium of an economy that is in a liquidity trap.
(b) Discuss the relative effectiveness of ï¬Âscal vs. monetary policy for a country in a liquidity trap. Make use of relevant diagrams in your answer.
(c) In reality, nominal and real interest rates tend to differ by the rate of inflation, π, such that i = r + π, where i is the nominal interest rate and r the real interest rate. On which of these interest rates should money demand principally depend on? How does this impact the existence of a liquidity trap and the effectiveness of monetary policy?
(a) A liquidity trap is a scenario in which interest rates are very close to zero. In this situation, they would not be interested to part with their cash holdings as the amount that they would get during this time is not lucrative. They would rather prefer holding money in the form of cash rather than bank deposits.
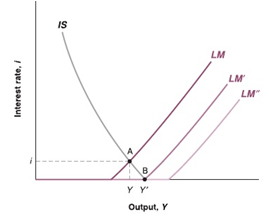
(b). In such situation, no monetary policy would not be effective. Any attempts on the part of policy makers to convince the people to hold money in the form of no liquid assets will not work merely by increasing the money supply. Hence changing the demand for money merely by altering the interest rate was no more phenomenon to control the happenings in the economy. Here comes the expansionary fiscal policy into the picture to overcome liquidity trap. Here attempts is made by the government to increase aggregate demand which happens through government expenditure or lowering the taxes.
(c). Ideally the economy must count on the real interest rate as the nominal interest rate considers inflation. It is the real interest rate which shows the amount of actual investment happening in the economy. It also shows the real income generated as mere creation of money is only going to build an inflationary pressure without any actual increase in the real output. Hence, loose monetary policy would only add to inflationary pressure.
Discuss the following statements within a Keynesian cross model. Make use of economic theory to substantiate your claims.
(a) In a closed economy where the private sector invests more that it saves, the government must be running a budget deï¬Âcit.
(b) To increase economic income in an open economy, the government should ban imports.
(c) The government budget multiplier is bigger in a closed economy than in an open economy.
(a). When investment is more than savings that means that the interest rate offered would low as the investment is high. This would generate lesser revenue for the government. But as the country expenses are high and there have been no changes in the government expenditure, this would led to increase in budget deficit.
(b). Government must ban imports and enter into trade as this would lead to the specialization in the production of those commodity which is cheaper to produce and would import which is expensive to produce. Hence, net exports would increase leading to the increase in the income of the country.
(c ). Government multiplier is bigger in closed economy than the openeconomy because the role of the government in terms of expenditure and intervention is comparatively more than in case of open economy. So it is higher.
Consider the following model:
C = C0 + c(Y −T),
I = I0 −br,
where C is consumption, I investment, Y is income and T denotes lump sum taxes. C0 > 0 and I0 > 0 are autonomous consumption and investment respectively, 0 < c < 1 is the marginal propensity to consume out of disposable income, and b > 0 is sensitivity of investment with respect to the real interest rate (r). Denote government spending as G and assume that money demand is give by:
(M/P)d = k(Y −T)−hr,
where k > 0 and h > 0.
Using the IS −LM model, show and discuss how the inclusion of T into the money demand function will affect the following:
(a) Derive the equilibrium levels of income and interest rate in this economy.
(b) If taxes were not included in the money demand function, ceteris paribus, equilibrium income and interest rate would be:
Y ∗ = h/bk + (1−c)h [C0 + I0 + G + b/h+M/P −cT]
r ∗ = k/bk + (1−c)h [C0 + I0 + G−cT]− (1−c/bk + (1−c)h M/P).
With this information, and your result in (a), discuss how the inclusion of taxes in the money demand function affect the analysis of changes in government expenditure and taxes.
(a) We see that due to the introduction of taxes , the real income declines and interest rate also falls. Equilibrium income falls from Y*4 to Y*3
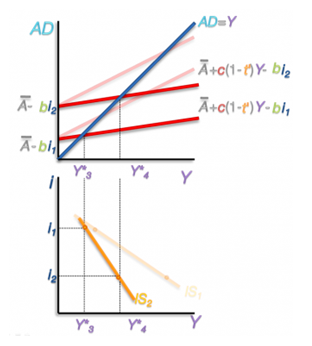
The rationale behind this is that due to the inclusion of taxes, consumption reduces due to the decreased in the disposable income. This causes reduction in the aggregate demand. Thus IS curve shifts to the left.
(b) Initially when the taxes are not included, aggregate demand is a function of consumption, investment, net of government purchases and taxes and net exports. It is assumed that except consumption everything is constant. Thus, any change in any these variable will cause shift in the IS curve. These shifts depends where there have been increase or decrease in the any of these variables. Thus, inclusion of government purchases would lead to the increase in the real income and interest rate of the economy. This will increase the aggregate demand and so the IS curve will shift to the right.
However, when taxes are included, income of the people falls. This leads to the reduction in the consumption causing downward shift in the aggregate demand curve. Ultimately leading the leftward shift in the IS curve.
Answer the following questions within a Keynesian Cross model. In your answer, make use of economic theory and state clearly any assumptions you make along the way.
(a) If the household saving rate in the UK was zero, what would be the impact of an increase in government spending?
(b) How does your answer to (a) change if the UK had a large trade deï¬Âcit with the rest of the world?
(c) How do your answers to (a) and (b) depend on how the UK raises tax revenues? In particular, does it matter whether the UK raises lump sum taxes, or proportional income taxes?
(a). If the savings rate is zero, the increase in government expenditure would lead to the shift in the planned expenditure curve upward causing an increase in income by [1/(1-mpc)] ∆G
(b). If there is trade deficit with the rest of the world, that means the government is spending more than its mean leading to higher increase in the expenditure. Thus, the extent of the increase in the expenditure will be more in this case.
(c). An increases in the taxes would reduce the disposable income by the amount t, (Y-t) and hence reduces the consumption by the amount MPC x ∆T. hence causing the planned expenditure to shift downward by MPC x ∆T.
An economy is described by the following relationships:
C = c0 + b(Y −T)
I = I
G = G
T = T
where C is consumption, I is investment, T are lump sum taxes, G is government spending, c0 is autonomous consumption, b is the marginal propensity to consume and Y is income.
(a) Derive the equation for equilibrium income, Y ∗. What is the government multiplier, i.e., the multiplier that shows by how much equilibrium income changes if government spending increases by 1 unit?
(b) Explain why the government multiplier is bigger than 1.
(c) Derive the tax multiplier in this economy, i.e., the multiplier that shows by how much equilibrium income changes if taxes increase by one unit.
(d) Discuss the relative sizes of the multipliers you derived in parts (a) and (c). What do they imply for the effectiveness of government spending relative to taxation?
(a) To determine equilibrium income (i.e. Y*). We start with the following (algebraic) set of equations:
C = C0 + b(DI)
I = Io
G = Go
T = To
X = M = 0
(C = consumption spending, b = marginal propensity to consume, c0= autonomous consumption, DI = disposable income, I = investment expenditure, G = government spending, X = exports, M = imports, and T = tax revenue)
The "o" subscripts are provided to distinguish these variables as autonomous expenditures.
Step1 - Find equilibrium:
Equate Y with Aggregate Expenditure, solve for Y*:
AE=Y=C+G+I+(X-M)
C= c0 + b(Y-T)
AE = Y = [b(Y - To) + c0] + Io + Go + (0 - 0)
Y* = (-bTo + c0 + Io + Go)/(1 - b)
Step 2 - Consider a change in G
suppose we allow for a change in govt. spending. If so, then:
G = Go + DG
Step 3 - Recalculate the new equilbrium:
Equate Y with the new AE, solve for Y**:
AE = Y = [b(Y - To) + c0] + Io + [Go + DG] + (0 - 0)
Y** = (-bTo + c0 + Io + [Go + DG])/(1 - b)
Step 4 - Determine the change in Y:
Subtract Y* from Y**:
Y** - Y* = [(-bTo + c0 + Io + [Go + DG])/(1 - b)] - [(-bTo + c0 + Io + Go)/(1 - b)]
Y** - Y* = (DG)/(1 - b)
DY = (DG)/(1 - b)
DY/DG = 1/(1 - b)
(b). The first is reason to be its value greater than one is, the multiplier on changes in government spending is larger than the multiplier on changes in marginal propensity to consume and second one is that as its value is government spending times to 1/(1 - b), where b, 0<b<1.
(c). In this case, we want to know how much a change in the tax rate will affect total income. Our derivation follows the same lines as before. In this case we have:
Y= b(Y-T) + I + G
dY= b (dY –dT)
dY(1-b)= - b dT
dY/dT= -b/(1-b)
In general government multiplier is greater than tax multiplier since marginal propensity to consume is less than & equal to 1.
If government reduces taxes by $1 unit, only the MPC x $1 unit is injected into the income stream.
(d). The size of the increase in GDP depends on the type of fiscal policy.
The multiplier on changes in government spending is larger than the multiplier on changes in taxation levels.
The taxation multiplier is smaller than the spending multiplier because part of any change in taxes is absorbed by savings.
To export a reference to this article please select a referencing stye below:
My Assignment Help. (2015). Tame Your Fear With Unmatched Assignment Help Services From Professional Writers. Retrieved from https://myassignmenthelp.com/free-samples/economic-equations-short-questions-and-answers.
"Tame Your Fear With Unmatched Assignment Help Services From Professional Writers." My Assignment Help, 2015, https://myassignmenthelp.com/free-samples/economic-equations-short-questions-and-answers.
My Assignment Help (2015) Tame Your Fear With Unmatched Assignment Help Services From Professional Writers [Online]. Available from: https://myassignmenthelp.com/free-samples/economic-equations-short-questions-and-answers
[Accessed 25 May 2025].
My Assignment Help. 'Tame Your Fear With Unmatched Assignment Help Services From Professional Writers' (My Assignment Help, 2015) <https://myassignmenthelp.com/free-samples/economic-equations-short-questions-and-answers> accessed 25 May 2025.
My Assignment Help. Tame Your Fear With Unmatched Assignment Help Services From Professional Writers [Internet]. My Assignment Help. 2015 [cited 25 May 2025]. Available from: https://myassignmenthelp.com/free-samples/economic-equations-short-questions-and-answers.