
Presentation of Financial Ratios of Two Companies
Describe about the Financial Performance of British Airway for Liquidity and Profitability.
This report focuses on the subject area of accounting. The primary component of the report is ratio analysis. The report discusses the financial ratios that are derived from the financial statements provided in the annual reports of the two companies, British Airways and Easy Jet. In the report mainly three types of financial ratios are derived – profitability ratios, liquidity ratios and efficiency ratios. At the same time, the report also explains the use of ratios at the time of financial planning and during the allocation of resources. At the end of the report, a conclusion is derived by considering the overall findings.
British Airways and Easy Jet are two most popular companies in the airline industry of UK. British Airways was founded in the year 1974 and Easy Jet was founded in the year 1995. Currently, British Airways is having access over total 183 destinations (Britishairways.com 2016).
On the other side, Easy Jet is providing airline services for around 134 destinations (Easyjet.com 2016). As per the annual report of these two companies, the financial ratios that are the profitability ratios, liquidity ratios and the efficiency ratios are shown in the below table:
Financial ratios of British Airways
|
Financial ratio |
2013 |
2014 |
2015 |
|
|
Current ratio |
0.63 |
0.65122 |
0.59649 |
|
|
Quick ratio |
0.60622 |
0.62704 |
0.57211 |
|
|
Receivable collection period |
3.51545 |
4.14242 |
4.47675 |
|
|
Inventory turnover period |
29.1364 |
32.4933 |
47.2833 |
|
Table 1: Financial ratios of British Airways for 2013 to 2015
(Source: Britishairways.com 2016)
Profitability ratio trend:

Figure 1: Profitability ratio trend
(Source: Britishairways.com 2016)
The above table showing the financial ratios of British Airways shows that the financial performance of the company has improved in terms of profitability of the company. In last three years that are from 2013 to 2015, the operating profit ratios of British Airways have increased gradually. In 2013, the operating profit ratio of the company was 5.70003, which increased to 8.31982 in 2014 and 11.1533 in 2015. On the other side, if the net profit ratio of the company is seen, then it can be observed that the increment in the net profit ratio of the company in 2015 was too much higher than 2013. The difference between the net profit ratio of British Airways in 2014 and 2015 was 16.14 (approx) (Britishairways.com 2016).
Liquidity ratio trend:

Figure 2: Liquidity ratio trend
(Source: Britishairways.com 2016)
Efficiency ratio trend:

Figure 3: Efficiency ratio trend
(Source: Britishairways.com 2016)
However, the liquidity position of the company has declined. The receivable collection period of the company is disclosing the fact that the company needs to improve its financial performance because the receivable collection period of British Airways has increased from 2013 to 2015. The same is also applicable if the analysis is done based on the inventory turnover period of the company.
Financial Ratios of British Airways
Financial ratios of Easy Jet
|
Financial Ratios |
2013 |
2014 |
2015 |
||
|
Operating profit ratio |
11.6721 |
12.8341 |
14.682 |
||
|
Net profit ratio |
9.34711 |
9.94036 |
11.6944 |
||
|
Current ratio |
1.05004 |
0.88803 |
0.72342 |
||
|
Quick ratio |
0.90935 |
0.74718 |
0.6069 |
||
|
Receivable collection period |
16.6299 |
16.1255 |
16.0457 |
||
|
Inventory turnover period |
168.195 |
162.584 |
140.28 |
||
Table 2: Financial ratios of Easy Jet from 2013 to 2015
(Source: Easyjet.com 2016)
Profitability ratio trend:
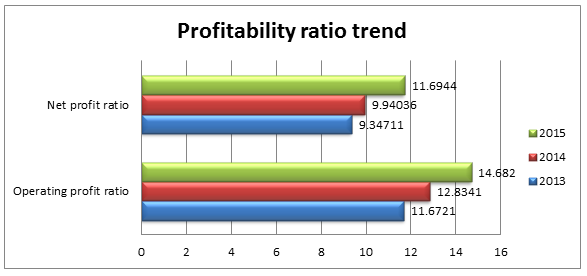
Figure 4: Profitability ratio trend
(Source: Easyjet.com 2016)
As per the financial ratios of Easy Jet shown in the above table, it can be clearly said that the overall performance of the company has been improved from 2013 to 2015. The operating profit ratio of the company has been increased by approx 3% from 2013 to 2015 and in case of the net profit ratio, the percentage increased was approx 2.5%. This is indicating that the financial performance has been improved in the last year (Easyjet.com 2016).
Liquidity ratio trend:

Figure 5: Liquidity ratio trend
(Source: Easyjet.com 2016)
Efficiency ratio trend:
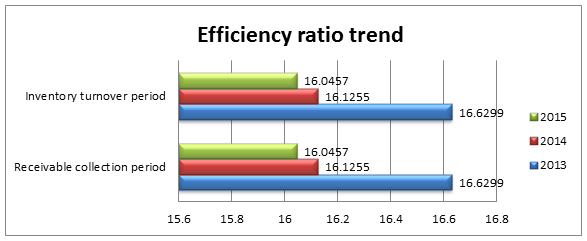
Figure 6: Efficiency ratio trend
(Source: Easyjet.com 2016)
However, if the liquidity position of the company is analyzed, then it can be said that the company needs to improve its liquidity positions. The major reason being that, the liquidity rate of the company has decreased gradually from 2013 to 2015. However, the declining percentage of liquidity ratios was nominal. Easy Jet also needs improvements in its inventory management system as it was much high from 2013 to 2015. At the same time, the receivable collection period is also high in this company. However, a static nature in the receivable collection period shows the static performance of the company, which is good.
As per the above-mentioned information, it is very clear that the financial performance of Easy Jet was better than the British Airways as per the profitability of the two companies. However, on the other side if the comparison is made between the other financial figures of two companies like, receivable collection period and inventory turnover, it can be mentioned that the position of British Airways was much higher than Easy Jet. In 2015, the profitability or the net profit ratio of British Airways enhanced at a high speed, which indicates the company has performed well in that years. However, in this context, Uechi et al. (2015) commented that the excessive increment in the net profit ratio of the company indicates that either the company has cut down its cost level aggressively. This is because the annual report of the company has mentioned that the revenue has decreased in 2015 than 2014 but the profit has increased in 2015 than 2014.
On the other side, if the performance of Easy Jet is considered, then it can be realized that the performance of Easy Jet has been improved in a small percentage. Henry and Robinson (2015) stated that small but continuous growth is better than the fluctuation in the financial performance of the company. Comparison between the financial figures that are stated in the annual reports of the two companies, it can be said that the expenditure level of Easy Jet was more or less static but in British Airways, the expenditure has been highly controlled in 2015 (Kassicieh, Ahluwalia and Majadillas 2015).
Profitability Ratio Trend
Apart from the profitability, if the comparison is done as per the liquidity positions of the companies, then it can be clearly observed that the liquidity position of Easy Jet was better than British Airways. In 2015, the current ratio of Easy Jet was 0.72 (approx) whereas, British Airways had the current ratio of 0.59 (approx). However, in this context, it is also noticeable that the liquidity position of Easy Jet has declined gradually, which denotes weak performance of the company. The same thing happened with the quick ratios of the companies. In the last year, the quick ratio of British Airways was 0.57211, whereas, the quick ratio of Easy Jet was 0.6069.
As per the efficiency ratios of the two companies in last three years, it can be said that the British Airways is much efficient than Easy Jet. This is because the receivable collection period and the inventory turnover ratios of Easy Jet were much higher than British Airways in last three years. In 2013, British Airways had the receivable collection period of 3.51545, whereas, Easy Jet had the receivable collection period of 16.6299. This indicates that British Airways can convert its receivables in to cash more quickly than Easy Jet. It denotes the efficiency level of British Airways was higher than Easy Jet (Robinson et al. 2015). The same thing is also applicable in case of the inventory turnover period of the two companies. Therefore, it is very important for Easy Jet to improve its efficiency ratios especially the inventory turnover period as soon as possible because the inventory turnover period is too high at Easy Jet.
Identifying and analyzing the financial ratios are the most important tasks that the management of the company must do while preparing the financial plan for a particular financial year. Financial ratios are very helpful for preparing proper financial plan and taking the appropriate financial decisions. The use of financial ratios in financial planning can be stated as under:
Financial ratios help to understand the efficiency level of the company (Pappa 2015). The management of the company can clearly understand the current level of financial performance of the organization and prepare the financial plan to improve the current situation or to maintain the same. In this context, Wang and Zhou (2016) argued that the ratio analysis of a company is done after the completion of a financial year. Therefore, the companies cannot take any effective measures for handling the uncertain situation because the planning is already done. However, Yadav (2015) commented that as the ratios are stated in the numerical form, management can understand the result clearly. The chances of taking wrong decision or wrong planning is very less if the financial ratios are considered.
Liquidity Ratio Trend
Financial ratios help to predict the future easily. If the management looks at the profitability ratios of the previous few years, then they can easily understand the trend of financial performance of the company. Therefore, it becomes easier for them to predict the future accurately. However, Healy and Palepu (2012) commented that as the financial ratios are dependent of the past data, it cannot predict the future accurately. However, in most of the companies, the financial planning is done based on the financial ratios, which denotes the importance of ratios in financial planning.
The financial ratios of the company help to understand the financial performance trend and liquidity position of the company (Wang and Zhou 2016). Therefore, by using the financial ratios, the company can identify the areas of deficiencies. Therefore, it becomes easier to take the effective measures to reduce or remove the deficiencies in the present and future financial years.
Ratio analysis helps the management of the organization or the financial planners to understand the financial statements in a simple way. However, Uechi et al. (2015) believed that the financial statements of the companies are already prepared in numerical terms and so the management of the companies can easily understand the performance level just by checking the financial statements (Wang and Zhou 2016). Therefore, the planning can be done in a better way.
The ratio analysis also helps to compare the financial performance of a particular company with the other companies in the same industry (Kassicieh, Ahluwalia and Majadillas 2015). Therefore using the ratios, the management can prepare the competitive financial plan for the future days
Other than the financial plan, the financial ratio analysis also helps to allocate the resources in a proper way. Ratio analysis helps to identify the resource allocation and resource use in the past financial years. This helps to identify how effectively the company has used the resources in the previous financial years. If the company identifies that the use of resources in the past years was not so effective, then the management can easily take the effective measures to enhance the resource utility (Robinson et al. 2015). At the same time, the management of the companies can also identify whether there is any inappropriate allocation was done in the previous financial years or not. If any inappropriate resource allocation is made in the previous years, then the management can take effective measures to improve the situation (Henry and Robinson 2015).
On the other side, the liquidity ratios of the company show the proportion of the liquid assets in a particular financial year in comparison to the liquid liabilities (Wang and nanceZhou 2016). The management can take effective strategies if the liquid asset is less than the liquid liabilities. Therefore, proper allocation of the assets can be done with the help of financial ratio analysis.
Conclusion
In this report, it has been identified that the financial performance of British Airways was weak in respected to the liquidity and profitability. However, in the year 2015, the profitability of the company has been improved at the high level. On the other side, in case of the other company that is Easy Jet, the profitability increased at more or less static rate. The liquidity position of Easy Jet was better than British Airways in last three years but the performance of the easy Jet has declined. The inventory management system at Easy Jet also needs improvement because it was much high in last three years.
Reference list:
Britishairways.com. 2016. Book Flights, Holidays & Check In Online | British Airways. [online] Available at: https://www.britishairways.com/ [Accessed 1 Aug. 2016].
Easyjet.com. 2016. Check out these great easyJet flights.. [online] Available at: https://www.easyjet.com/en/ [Accessed 1 Aug. 2016].
Healy, P.M. and Palepu, K.G., 2012. Business Analysis Valuation: Using Financial Statements. Cengage Learning.
Henry, E. and Robinson, T.R., 2015. Chapter 1. Financial Statement Analysis: An Introduction. CFA Institute Investment Books, 2015(2), pp.1-35.
Kassicieh, S., Ahluwalia, S. and Majadillas, M.A., 2015. Financial analysis in management of technology programs: links in a clinical approach.Technological Forecasting and Social Change, 100, pp.66-77.
Pappa, A., 2015. Financial statement analysis of a multinational company and equity valuation of computer-based technology group.
Robinson, T.R., Henry, E., Pirie, W.L. and Broihahn, M.A., 2015.International financial statement analysis. John Wiley & Sons.
Uechi, L., Akutsu, T., Stanley, H.E., Marcus, A.J. and Kenett, D.Y., 2015. Sector dominance ratio analysis of financial markets. Physica A: Statistical Mechanics and its Applications, 421, pp.488-509.
Wang, D. and Zhou, F., 2016. The Application of Financial Analysis in Business Management. Open Journal of Business and Management, 4(03), p.471.
Yadav, R.J., 2015. Innovative Approach of Financial Statement Analysis from Bankers' Perspectives-a Case Study. The MA Journal, 50(8), pp.76-83.
To export a reference to this article please select a referencing stye below:
My Assignment Help. (2017). Financial Performance Of British Airways: Liquidity And Profitability Analysis. Retrieved from https://myassignmenthelp.com/free-samples/financial-performance-of-british-airway-liquidity-and-profitability.
"Financial Performance Of British Airways: Liquidity And Profitability Analysis." My Assignment Help, 2017, https://myassignmenthelp.com/free-samples/financial-performance-of-british-airway-liquidity-and-profitability.
My Assignment Help (2017) Financial Performance Of British Airways: Liquidity And Profitability Analysis [Online]. Available from: https://myassignmenthelp.com/free-samples/financial-performance-of-british-airway-liquidity-and-profitability
[Accessed 20 May 2025].
My Assignment Help. 'Financial Performance Of British Airways: Liquidity And Profitability Analysis' (My Assignment Help, 2017) <https://myassignmenthelp.com/free-samples/financial-performance-of-british-airway-liquidity-and-profitability> accessed 20 May 2025.
My Assignment Help. Financial Performance Of British Airways: Liquidity And Profitability Analysis [Internet]. My Assignment Help. 2017 [cited 20 May 2025]. Available from: https://myassignmenthelp.com/free-samples/financial-performance-of-british-airway-liquidity-and-profitability.