
Overview of McDonalds and Its Products
Question:
Describe about the Financial Statement Analysis of McDonalds?
Introduction
McDonalds is one of the largest food chain in worldwide. McDonalds is serving more than 72 million customers every day. Company has branches in more than 120 nations. McDonalds operated in franchisee form of business. In 2013, company able to garnered more than 28 billion as per its annual report. Company is known as the world second largest employer company just behind the Wal-Mart. Some of the major products and services sold by the company is burgers, fries and soft drinks (Carlson Fisher & Giammarino, 2008). Company is been opened by Richard and Maurice McDonalds brothers in 1940. McDonalds is only company which branches more than 120 nations where more than 6o billion employers works. Company is known for the strong capital structure and strong market hold in the capital market. McDonalds is one of blue chip Company which is holds strong market in the market.
Working capital ratio = current asset – current liabilities
|
Ratios of McDonalds |
2013 |
2012 |
|
Working capital ratio Current asset- current liabilities |
5050.1-3170 =1880 |
4992.1-3403.1 =1589 |
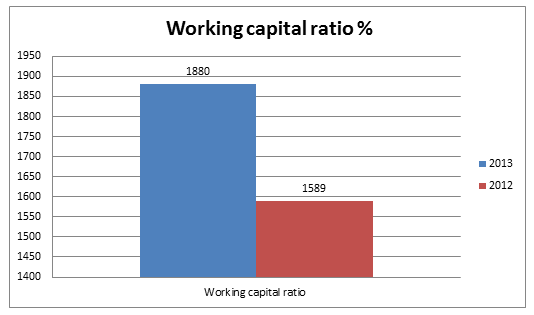
Working capital ratio of McDonalds shows that, company is performing exceptionally well as the company has higher working capital ratio. Company working capital cycle is been very much able to generate cash from their operation adequately (Woelfel, 2009). This is because company has been able to reduce its working capital cycle by giving the discount to its franchisee client which helps the company to generate the large income.
Although company working capital cycle is very much strong but the actual cash inflow and outflow cannot only be only be assumed with the current formula. Working capital cycle can be strong but the trade payables and trade receivables of the company is very much poor in compare to previous year (www.aboutmcdonalds.com, 2015). IN FY 12 the company has working capital worth of 1589 million but in the FY 2104 it is higher. This is because of the implementations of E-procurement and JIT implementation within the supply chain of the McDonalds.
|
Ratios of McDonalds |
2013 |
2012 |
|
Liquidity ratio Current asset/current liability |
5050.1/3170 =1.5 |
4992.1/3403.1 =1.46 |
Current ratio of the company shows that, company actual current ratio performance. Current ratio of the company suggests that, it has strong positions than previous year. But the production of the company is higher than before as because of the JIT which has been installed din the year 2009. Initially company was using the assembly line production in its operations which why the current ratio in 1990-2006 was below 0.55 (News.mcdonalds.com, 2015).
|
Ratios of McDonalds |
2013 |
2012 |
|
Quick ratio Current asset- inventory/ current liability |
5050.1-123.7/ 3170 =1.55 |
4992.1- 121.7/3403.1 =1.43 |
Quick ratio generally shows how well company will be able to meet its short term obligations. This ratio is also known as the acid test ratio. The quick ratio depicts actual current asset – inventory of McDonalds and figures out whether company has sufficient cash to meet its short term obligations or not as because the inventory are generally is closing stock (Woelfel, 2009). Quick ratio of the McDonald In FY 12 is 1.43 in compare to the FY 13 the ratio is higher. This is because the reason in FY 12 company has higher amount of inventory that helps the company to gain right kind of exposure (Graham et al. 2014).
Working Capital Ratio of McDonalds
In recent times company has able to maintain the balanced score card which help the company to assess the actual performance of technology and manpower. However, the result is been favourable (News.mcdonalds.com, 2015).
|
Ratios of McDonalds |
2013 |
2012 |
|
Debt to equity ratio Debt/equity |
14129.8/ 16009.7 =0.88 |
13632.5/15,293.9 =0.89 |
Debt equity ratios of the company suggest that, company has majorly dependent on the debt than equity. As the company has acquire more than 52% of shares with itself in order to maintain the decision making. Therefore it can be said that, company is basically a capital intensive rather than labour intensive (www.aboutmcdonalds.com, 2015) . Most of all debt equity ratio of the company shows that company has increased its long term debt by 14129 in FY 2013 as in compare to FY 12 it was 13632.5. This shows that, company is higher dependent on the debt than equity. Although it is very much risky form of decision making because the company has to pay the high interest rates irrespective of the company performance (Sondi & White, 2014).
|
Ratios of McDonalds |
2013 |
2012 |
|
Debt ratio Total liabilities/total asset |
17446.6/36626.3 0.47 |
20092.9/35386.5 =0.56 |
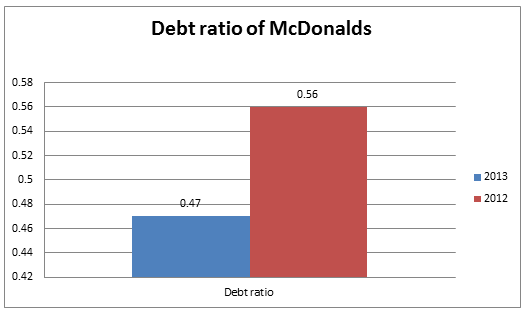
The total debt equity ratio of the company suggests that company is mostly dependent upon the debt ratio. The debt ratio of McDonalds is very much shows that the total debt in FY 13 is higher than FY 12. This is because company has long term liabilities worth of 14129 and accrued interest worth of 221.6 million. This has increased the debt ratio of McDonalds which is very much riskier for the company in future (News.mcdonalds.com, 2015). Although McDonalds has strongly built their goodwill based on its innovations and creativity while manufacturing its products. but since the 21st century , company is facing tough competition from the rivals companies whose growth are being impeccable. The restaurants game has been changed so far as because of the fast-food companies are coming up with new ideas and variety in their platter to attract the customer base (Costales, 2010).
However, the rise in the debt ratio is because of the company has spend more than 5.7 million in FY 213 , for coming up with customized burger pilot programme more than 2000 US restaurants chain. This programme has cost the company dearly as company and most probably benefit for the business will be given in near future (News.mcdonalds.com, 2015).
|
Ratios of McDonalds |
2013 |
2012 |
|
Equity ratio Total equity /total asset |
16009.7/36626.3 =0.43 |
15293.6/ 35386.5 =0.43 |
The total equity ratio of the company is very much consistent because of the as per the above given information’s. Most of all in FY 13 Company is not been able to keep up their total asset higher in compare to FY 12 which was 1380 million (Stickney & Weil, 2009). Since the company has closed number of their sick units and higher debt ratio has lowered down the equity ratio of the company.
There has unanimous decision made by the board of the director and CEO of the company which is to reduce in the expansion of restaurants. Company has been facing tough to manage its 3rd quarter results which is declining in compare to the competitors like Big Mac and KFC (Arthur, Cheng & Czernkowski, 2010). Apart from that, using higher debt ratio with 70% and equity of 30% is been one of the major reason for the failure to attract the investor to invest for long time in company as per the FT (Financial Times).
|
Ratios of McDonalds |
2013 |
2012 |
|
Inventory turnover ratio COGS/Inventory 365/turnover |
19341.4/123.7 =156.35 365/156.35 2.33 |
27567/121.7 226.5 1.61 |
Liquidity Ratio of McDonalds
Inventory turnover ratio of the company suggests that, McDonalds is having higher sales in compare to FY 13. As the company has come up with new and better ideas to formulate the recipe and keep attracting the customer. Although the new recipe like McEgg, Mcveggies and McCheese are been popular but company fails decrease its inventory turnover ratio. As the standard format the lower the inventory turn ratio is the better chances of the increase in sales.
The inventory of the company in FY 213 was 2 days which initially in FY 12 was 1 and half day. This has shows that , McDonalds has not been able to generate the higher sales with their innovations in recipe. This is because of the recipe like McPo and McBE which are pork and beef which are not usually sold in the Asian market (Berger, Ofek & Swary, 2012). McDonalds has been very much able to generate the higher sales in UK and IS market as price of the Mc is been one of the major issues which is been increasing (News.mcdonalds.com, 2015). Another major reason for reduction in the inventory turnover of the McDonalds is their logistics which was initially poor and problems of leakages are higher.
Therefore, in FY 13 December, company has come up with new ideas of selling of grilled chicken to reduce the ingredients. It is one of the major part of cost reduction programme by the company which will available for more than 14300 stores in US by end of the next week as per the NEW York Ap. The FY 13 sales of the company is being higher in compare to the previous week which is why the inventory turnover days are higher (Berry, 2009).
|
Ratios of McDonalds |
2013 |
2012 |
|
Accounts receivable ratio (Net sales/ average accounts receivable)/365 |
18874.2/ 659.9 28.60 12 days |
18602.5/687.65 27 13. days |
An account receivable days of the company is higher because of their gap in the accounts payables. Since, the company has higher accounts receivable ration in FY 13 with 13 days because of the franchisee payment or royalty credit note is been increasing (Brigham & Houston, 2009). There has been large gap in the accounts receivable and accounts payables ratio. The creditors specifically franchisee holder are disappointed from their payments (www.aboutmcdonalds.com, 2015).

The rise in the accounts payables which is 1086 in FY 13, this is because sales of the most of the franchisee business in EU and Asian market has dipped down because of the competitors like Chinese food , pizza and other burger companies (Campbell & Shiller, 2013).
Accounts receivable of the company is going to improve by FY 15 because of the company is offering the large amount of discount to existing franchisee holder of early payments.
|
Ratios of McDonalds |
2013 |
2012 |
|
Total asset turnover Sales/total asset |
28105.7/ 36626.3 0.76 |
27567/ 35386.5 0.77 |
The total asset of the turnover of the company represents the efficiency of the ratio that help to analyse the company capability to generate the sales from its existing total asset. The asset turnover ratio of the McDonalds is 0.76 in FY 13 in compare to the FY 12 which is showing higher. This is because McDonalds has closed more than 68 restaurants of their chain in US because of lower productivity and sales (Hashemi, 2013). In France, more than 2100 employees of restaurant went for strike and lock out because of the hiring and firing process of the McDonalds.
Quick Ratio of McDonalds
The existing manpower of the company are highly skilled by closing the sick unit there will be rise in the unemployment in US. Most of all company is been using its existing asset to change it sales because company already has invested more than 221 million in centralizing its operation by E-procurement and E-logistics (www.aboutmcdonalds.com, 2015).
|
Ratios of McDonalds |
2013 |
2012 |
|
GP margin Gross profit/ Net sales |
8764.3/5585.9 1.56 |
8604.6/5464.8 1.57 |
The Gross profit margin of the country is higher in FY 12 with 1.57 in compare to FY 13 which was 1.56. The gross profit of the company suggest that, company has higher cost of the goods sol which is why company operating profit for FY 12 was lower by 379 million. In FY 13 the operating cost of the company is 19341.4 (Hashemi, 2013). because of the good and per price is 6361.3 and employee payroll is increased by 4824 million as per its annual report.
The gross profit margin has been reduced in FY 13 because of the rise in the raw materials like bread, meat, paper, soft drinks and payroll. The major increase in the ware material has been one of the major reasons for decrease in the GP margin (Brigham & Houston, 2009).
|
Ratios of McDonalds |
2013 |
2012 |
|
ROA Net income /total asset |
5585.9/36626.3 0.15 |
5464.8/ 35386.5 0.15 |
ROA (return on asset) of the company shows that company performance is very much same in FY 12 and FY 13. One of the major reason for the failure of the growth of ROA in FY 13 is lower because of the franchisee sales of the company is not been able to generate large income because of the total asset of the company is lower in FY 134 (Campbell & Shiller, 2013). As the company has sold most of its sick units in Orlando, Mississippi and Seattle to reduce the cost of goods sold of the company.
In FY 12 company has decent RPA as the company has invested most in digital marketing which is apps and ICT to connect with their global customers. By giving them discounts coupon and the various other offers to attract the customer worldwide (www.aboutmcdonalds.com, 2015).
|
Ratios of McDonalds |
2013 |
2012 |
|
EPS Net income/Number of shares outstanding |
5585.9/998.4 5.6 |
5464.8/1010.1 5.4 |
EPS of the company is very much stable as because investor has strong faith in the company future growth which is why company has able to generate the higher profit. While assessing the EPS of the company , net income and number of share outstanding is taken in considerations.
|
date |
close |
volume |
open |
high |
low |
|
1/13/2014 |
94.83 |
5753201 |
95.83 |
95.83 |
94.59 |
|
1/10/2014 |
95.8 |
5512233 |
95.83 |
96.22 |
95.64 |
|
1/8/2014 |
95.41 |
7653903 |
95.55 |
95.71 |
95 |
|
1/7/2014 |
96.38 |
4881787 |
96.38 |
97.08 |
96.13 |
|
2/14/2012 |
99.55 |
3520703 |
99.51 |
99.64 |
98.95 |
|
2/13/2012 |
99.65 |
2965636 |
99.72 |
99.9198 |
99.28 |
|
2/10/2012 |
99.47 |
3871018 |
99.52 |
99.66 |
98.94 |
|
2/9/2012 |
99.99 |
3599302 |
100.06 |
100.46 |
99.7 |
|
1/31/2012 |
99.05 |
6563026 |
99.04 |
99.26 |
98.25 |
|
1/30/2012 |
98.69 |
6075981 |
98.04 |
98.81 |
97.7 |
|
12/27/2011 |
100.55 |
3032607 |
100.17 |
100.82 |
100 |
|
4/6/2010 |
67.81 |
3318247 |
67.77 |
67.96 |
67.65 |
|
4/5/2010 |
68.03 |
4875149 |
67.76 |
68.2 |
67.76 |
|
4/1/2010 |
67.58 |
5473763 |
67.06 |
67.71 |
67.06 |

EPS of the McDonalds shows that there has severe growth in the recent times but company fails to improve its current EPS because of the rise in competition in market . As the company growth has been decreased by 4.7% every year because of the rise in competition in the market has been one of the major reasons (Hashemi, 2013). Although the price of the share is been increased but the growth is too much fluctuated as per the FY 12, FY 13 and FY 14.
|
Ratios of McDonalds |
2013 |
2012 |
|
PE ratio Price per share/ EPS |
5.59/ 5.6 =0.09 |
5.41/5.4 0.10 |
PE ratio of the company is showing slow growth in the PE ratio. Price earnings ratio depicts how much an investor is willing to pay for purchasing the shares of the company. Since then, growth of PE ratio is very much lower in FY 13 and is poor because of the slower growth of the company.
Debt to Equity Ratio of McDonalds
Apart from that, too much of complaints and too much legal notice on the company has hamper its goodwill which is why company has poor PE ratio (Arthur, Cheng & Czernkowski, 2010). Too much of fluctuation in share price shows that company needs to improve its existing strategy like higher debt and reduce the amount if COGS would attract the new customer base towards the company in FY 13.
|
Ratios of McDonalds |
2013 |
2012 |
|
Dividend payout ratio dividend per share/EPS |
3.12/5.6 0.55 |
2.87/5.4 0.53 |
Dividend payout ratio of the company is very much higher in FY 13 in compare to FY 12. With rise in the DP ratio, company will be able to generate the large customer base. The dividend payout ratio of the company is poor and is not been able to generate higher growth which is because of rise in the DP to the investors (Arthur, Cheng & Czernkowski, 2010). As the rise in the DP Shows Company has to pay higher amount of DP which is why company profit of share is bee decreased by 3.5%. Rise in the DP has attracted the fundamental investor to invest in the company but it has also affected the company net come severly in FY 13 and FY 13.
ROCE
|
Ratios of McDonalds |
2013 |
2012 |
|
ROCE EBIT /capital employed |
8204.5/33456.3 0.24 |
8604.6/ 31983.4 0.26 |
ROCE of the company is very much higher in FY 13 with 0.24. One of the major reason for the failure of the ROCE is in FY 13 because of the company has investment in various types of programmes like Digital marketing and flagship model of operation has been yet to give the profit. the flagship and model and 24 storey inventory system is been one of the major investment area dine by the company to increase its profit in the long run (Sondi & White, 2014).
However, In FY 12 company has able to generate decent amount of the ROCE because of the innovations in recipes and the various types of offers which is old school but were very much effective.
ROE
|
Ratios of McDonalds |
2013 |
2012 |
|
ROE Net income /average share holder equity |
5585.9/ 8004.8 0.69 |
5464.8/ 7646.8 0.71 |
ROE of the McDonalds is very much higher and able to generate large customer base in FY 12 because of the strategy like offering a equity as divined rather than cash dividend. ROE (Return on equity) of the company is very subtle in 212 with such strategy. However, one of the major long term effect of the equity as dividend is show in the FY 2013.
This equity dividend has decrease the price of shares in the market simultaneously because of the too much shares and too few buyers. One of the major problems for the McDonalds for right now is that the company is sales are falling all of the three major areas EU because of the rise in the inflations, Asia because of the hala meat and other scandals and In US because of the severe competition (Costales, 2010).

From the above , analysis, liquidity ratio of the McDonalds is very much shows that , company has ideal liquidity position with 1.5. Apart from that company has taken any kind of short term loan to manage and control its short term obligations. This shows that, company is able to accounts receivables and accounts payables is balanced. Whereas when it comes to profitability ration , company is growth rate is decreasing which is because of increases rate of raw materials and huge competition of rivals like subway and KFC.
Equity Ratio of McDonalds
Lastly, fixed asset turnover of McDonalds is 1.19 which shows that, company has enough ability to generate the high net sales from the existing fixed resources. Apart from company has opened new restaurants and has enough manpower to manage its food chain. PE ratio of the company is showing 17.7p this is because company is not able to perform well because of the higher rivals firms like Subway and KFC are slowly coming with the innovative ideas to attract the customers.
From the above , it has been found that, the McDonalds is very much in trouble because of rising the long term loan and increasing the competition in market. Apart from that, if conversion cycle shows larger result then it will not be a healthier cycle for McDonalds and on the other side if the conversion cycle shows smaller result then the company will receive payment in quick time. Moreover, cash conversion cycle will help McDonalds in measuring how efficiently and quickly they can pull out cash from operation. Further, conversion cycle will let McDonalds know when they can be able to pay to their suppliers. Thus, the study has help in better understanding the gap between account receivables and account payable.
Reduce the working capital cycle phases: the working cpital cycle of the company shows that, company is not able to perform well in terms of its balancing the accounts receivable and accounts payables.
Use of Equity financing: Company is using less of equity and more of debt which is increasing the risk of liquidity in future. Apart from that, company should look to use the equity financing is much safer in terms of the high interest rate payments.
Reference List
Books
Woelfel, C. (2009) Financial statement analysis. 4th ed. Harlow: Financial Times Prentice Hall.
Graham, B. et al. 2014) Graham and Dodd's security analysis. 5th ed. Oxford: Butterworth-Heinemann.
Sondi, A. & White, G. (2014) The Analysis And Use Of Financial Statements, 3rd ed. London: Thomson.
Costales, S. B. (2010) The guide to understanding financial statements. 4th ed. London: Palgrave Macmillan.
Stickney, C. & Weil, R. (2009) Financial accounting: an introduction to concepts, methods, and uses. 5th ed. London: Routledge.
Journals
Arthur, N., Cheng, M. & Czernkowski, R. (2010) "Cash flow disaggregation and the prediction of future earnings". Accounting & Finance, 50, pp. 1–30.
Berger, P., Ofek, E. & Swary, I. (2012) "Investor valuation of the abandonment option", Journal of Financial Economics, 42, pp. 257–287
Berry, A., (2009). Financial Accounting: an introduction. 4th ed. California: Random House.
Brigham, E., & Houston, J., (2009) Fundamentals of Financial Management. 5th ed. London: McGraw-Hill
Campbell, J. & Shiller, R. (2013) The dividend-price ratio and expectations of future dividends and discount factors. Review of Financial Studies 1, 195–228.
Hashemi, S. A. (2013) Analyze the relationship between operating cash flows and accruals, operating cash flow forecasting model, according and Auditing Review, 38, 1-24.
Websites
www.aboutmcdonalds.com/content/dam/AboutMcDonalds/Investors/McDs2013AnnualReport.pdf,. (2015). McDonald Annual report 2013. Retrieved 2 April 2015, from https://www.aboutmcdonalds.com/content/dam/AboutMcDonalds/Investors/McDs2013AnnualReport.pdf
News.mcdonalds.com,. (2015). McDonalds - McDonald’s – Official Global Corporate Website. Retrieved 2 April 2015, from https://news.mcdonalds.com/Corporate/Press-Releases/Financial-Release?xmlreleaseid=123057.
To export a reference to this article please select a referencing stye below:
My Assignment Help. (2016). McDonalds: A Global Food Chain Serving Millions Daily, Essay.. Retrieved from https://myassignmenthelp.com/free-samples/financial-statement-analysis-mcdonalds.
"McDonalds: A Global Food Chain Serving Millions Daily, Essay.." My Assignment Help, 2016, https://myassignmenthelp.com/free-samples/financial-statement-analysis-mcdonalds.
My Assignment Help (2016) McDonalds: A Global Food Chain Serving Millions Daily, Essay. [Online]. Available from: https://myassignmenthelp.com/free-samples/financial-statement-analysis-mcdonalds
[Accessed 26 May 2025].
My Assignment Help. 'McDonalds: A Global Food Chain Serving Millions Daily, Essay.' (My Assignment Help, 2016) <https://myassignmenthelp.com/free-samples/financial-statement-analysis-mcdonalds> accessed 26 May 2025.
My Assignment Help. McDonalds: A Global Food Chain Serving Millions Daily, Essay. [Internet]. My Assignment Help. 2016 [cited 26 May 2025]. Available from: https://myassignmenthelp.com/free-samples/financial-statement-analysis-mcdonalds.