
Isolation and Identification of Microorganisms
Describe about the Genetic Transformation?
The field of microbiology deals with the study of the microorganisms like bacteria, virus, fungi, protozoa and archaea. The research on these micro organisms involve the biochemical, physiological, cellular, ecological, clinical and evolutionary aspect also. In order to identify the microorganisms, the very first techniques employed in microbiology lad is the streaking and plating of the bacteria, so that pure colonies of the bacteria are obtained and it is easier to identify the species. The series of methods followed after this are the serial dilution and then plating. Following this, the transformation of bacteria can be carried out so that the gene of interest can be inserted into the genome of the bacteria. The ability of the bacteria to take up genes of different origins, have made it possible to clone many genes including the genes of the humans (Moran et al. 2012). After the transformation process, it is important to observe the bacterial cells under the microscope so that the efficiency of transformation and the success rate. The present report also deals with the analysis of the tolerance capacity in the bacterial biofilms vs. the planktonic cells.
Microbial inhabitants have evolved to survive in a variety of ecological niches and growth habitats. Some grow rapidly, some slowly. Some can replicate with minimal number of nutrients present, whereas others require enriched nutrients to survive. Variation exists in atmospheric growth conditions, temperature requirements, and the cell structure. This diversity is also found in the micro-organisms that inhabit the human body as normal flora, as opportunistic pathogens, or as true pathogens. Each microbe has its own unique physiology and metabolic pathway that allow it to survive in a particular habitat (Relman, D. 2012).
One of the main roles of a diagnostic or clinical microbiologist is to isolate, identify and analyse the bacteria that causes disease in humans. Knowledge of microbial structure and physiology is extremely important to clinical microbiologists in three areas:
Culture of organisms from patient specimens
Classification and identification of organisms after they have been isolated
Prediction and interpretation of antimicrobial susceptibility patterns
The main aim of the techniques of microbiology is to isolate and identify the micro organisms and use them for various biotechnological applications. The purification of bacteria is carried out with the help of the streak plate technique which enables the isolation of the pure colonies from inoculums by creation of areas that have increasing dilution on the single plate of agar (Gudina et al. 2012).
In natural habitats microorganisms usually grow in complex, mixed populations containing several species. This presents a problem for the microbiologist because a single type of microorganism cannot be studied adequately in a mixed culture. One needs a pure culture, a population of cells arising from a single cell, to characterize an individual species. Pure cultures are so important that the development of pure culture techniques by the German bacteriologist Robert Koch transformed microbiology. Within about 20 years after the development of pure culture techniques most pathogens responsible for the major human bacterial diseases had been isolated (Tortura, P, Funke, B and Case, C. 2013).
Pseudomonas fluorescens - A Non-Pathogenic Saprophyte
In this report the major organism on which the focus is laid is Pseudomonas fluorescens, which is a non pathogenic saprophyte that colonizes water, soil and even the plant surface. This microbe suppresses the plant diseases by producing a number of secondary metabolites like antibiotics, siderophores and hydrogen cyanide. This microbe has the ability to enter into the plant vascular system and reach various parts of the plant and act like a systemic bio control agent against various bacterial and fungal diseases (Dr. Ranjan Laboratories 2008).
Another component of this report is to determine the level of antibiotic resistance in the bacterial culture. The antibiotic resistance is said to occur when the bacteria undergoes change in some way such that there is reduction or elimination of the efficacy of the drugs/ chemicals or the agents that aim at curing or preventing infections. Antibiotic resistance occurs when the antibiotic has lost its efficacy in killing the bacteria or fighting the infection. If the bacterial strain, against which the antibiotic is being used, develops the resistance, then even the high dose of antibiotic would not harm the bacteria and it will keep on growing.
Whenever the studies need to be performed for research purpose, the use of E. coli bacteria is preferred. This is because the observation of the outgrowth of the members of the Enterobacteriaceae family (including E. coli) is easier as they are facultative anaerobes rather than obligate anaerobes (Mueller, K 2013). In this experiment, the procedure of plating and transformation of the E. coli cells is carried out. The aim of the experiment is to isolate the transformed colonies of bacteria and observe them for antibiotic resistance. In the second part of the experiment, the aim is to identify which has better antibiotic resistance- planktonic cells or the biofilms produced by the bacteria.
Practical 1
Purification of bacteria was done by the streak plating technique that creates areas with increased dilutions such that every bacteria is far off from other bacteria and spread on the plate individually. Agar plates were prepared with 1.5% agarose and were incubated. The culture was streaked on the plates with the help of the inoculum loop. The plate is streaked sector wise (four quadrants). Following this, the serial dilution of the bacterial culture is prepared by making a serial 10 fold dilutions starting from 10-9. The aliquots of 1 ml bacterial culture to 9 ml of PBS (phosphate buffer saline) are added. A loopful from each of the dilutions is then spread on the agar plates individually. The next technique is the genetic transformation of the bacteria using the pGLO plasmid DNA. The aim of this method is to incorporate two genes into the E coli cell line- one that codes for the GFP (green fluorescent protein) and th eother that provides resistance to ampicillin antibiotic. The process is carried out in the presence of calcium chloride solution and the plasmid DNA of pGLO plasmid. A small loopful of the bacterial cells is added to tubes labeled as +pGLO and –pGLO and the transformation solution (CaCl2) is also added. In +pGLO tube, 10 ul of pGLO plasmid is added and in the –pGLO tube no plasmid is added and it is taken as the control. The tubes are incubated and post incubation, heat shock is given to break the cell wall so as to allow the penetration into the nucleus.
Antibiotic Resistance in Bacterial Culture
Practical 2
The first step in this practical was to determine the observation and other records from the previous pratical and then carry out Gram staining to characterize the bacteria. The protocol starts with the preparation of smear of the bacterial culture and then adding crystal violet. The glass slide is then gently washed with water and then gram’s iodine is added, kept for 60 seconds and then washed with distilled water. The decolorizing solution is then added and the blue dye flows out. The solution is made up of 95% ethanol. The decolorizing solution is again washed off with water and counterstain Gram’s safranin is then added and kept for 60 seconds. The slides were then observed under the microscope and the gram negative and gram positive bacteria were analysed. The next protocol was that of preparation of E. coli cultures of biofilms.
Practical 3
The aim of this experiment was to analyse the strength of the biofilms against the antibiotics and then comparison of the resistance with the resistance to the planktonic cells of the same species. The protocol was carried out by preparing the dilutions of the biofilm culture and then treating them with the specific volume of antibiotic and then preparing the dilutions of planktonic cell culture and again treating them with the antibiotic. The number of cells that survived was seen/ observed with the help of the microscope and the total surface covered by the dead and live cells was evaluated.
The microbiological experiements were done to identify and analyse the rate of success of transformation of the pGLO plasmid into the genome of the E. coli bacteria and also the analysis of rate of successful development of antibiotic resistance in cell culture biofils and against the planktonic cells of same species, was also observed. The experiment was successful to a certain extent. The (+) LB/amp/ara plate contained a number of colonies of cells, which when exposed to the UV rays, fluoresced. On the contrary, the (-) LB/ amp/ ara plates contained no colonies. This concluded that the colonies in the former case were the transformed bacteria that had incorporated the GFP gene and the antibiotic resistant gene (derived from the pGLO plasmid). While in the latter case, the transformation was not successful and hence, the original bacterial cells did not survive in the presence of the antibiotic ampicillin. However, negative results were obtained on the (-) LB/amp plate and these colonies glowed under the UV light. Moreover, there were no signs of any colonies on the (+) LB/Amp plate, which was a negative result. Probably, the transfer of the colonies via loop on the plate was error prone and this might have led to loss of accurate data.
The results of the third practical are demonstrated in the appendix section.
The graphical analysis of the antibiotic resistance in planktonic cells and biofilm was done and Fischer two tailed test was carried out to determine the statistical significance of the categorical data that was obtained. The exact hypergeometric probability of the Fisher test was found to be 0.0003693, which is significant enough to reject the null hypothesis and provides the evidence that significant difference exists between the two groups. The t test score of 0.008857 is also significant and can be used in determination of p value which will further prove if the null hypothesis is correct or wrong. The two tailed probability is used when the direction of the difference between the two entities is not specified. The score obtained corresponds to a very significant value and therefore there exists a significant difference between the number of dead and live cells in planktonic and biofilm, with and without the antibiotics.
Plating and Transformation of E. coli Cells
In the comparative graphical analysis of the number of dead cells in the control plate and the antibiotic treated plate, varying results were obtained.
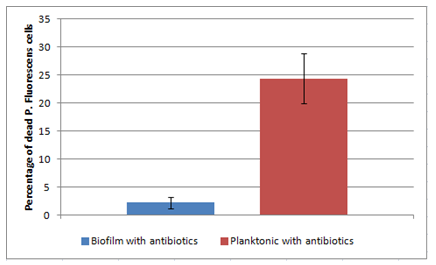
Graph 1: Comparative analysis of the number of dead cells in biofilm with antibiotics and planktonic with antibiotics.
The graph shows that the number (percentage) of dead cells in the plate of planktonic cells that were treated with antibiotics, was more than the percentage in the biofilm plate.
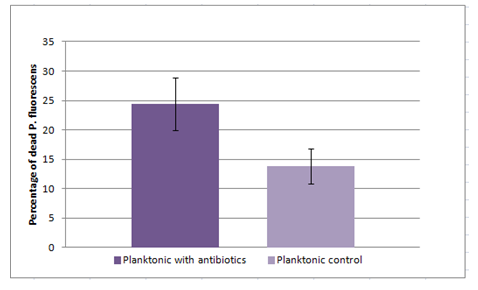
Graph 2: Comparative analysis of the number of dead cells in planktonic control plate and planktonic cells incubated with antibiotic
The graph shows that the relative number of dead cells in the control were less as compared to the number of dead cells found in the antibiotic treated plate.
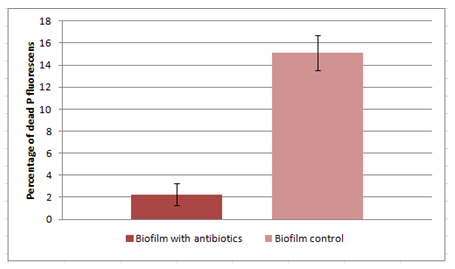
Graph 3: Comparative analysis of the number of dead cells in Biofilm control plate and biofilm cells incubated with antibiotic.
The graph shows a deviated result because the number of dead cells in the control plate are found to be more than the number of dead cells in the antibiotic treated plate.
The very first step in any microbiological experiment related to the isolation and identification of the bacteria, is the proper streaking and plating technique. The experiment of streaking and plating was done successfully and colonies of pure culture were also obtained. In the next step of transformation, there was successful transformation of the E. coli cells and this was determined by plating the inoculums on the LB agar plate that contained ampicillin antibiotic. The successful transformation was visualized under the UV rays and the colonies were found to be illuminated.
The antibiotic resistance in planktonic bacteria is related to the inactivation of the antibiotic, thereby leading to the modification of the targets and eventually exclusion of the antibiotic. On the other hand, the biofilm is a result of increase in the resistance of the constituent microbes, to the stressors or the antibiotics. This biofilm acts as a protective environment and protects and helps the bacteria to survive by increasing the inherent resistance of the micro organism (Paraje, M. 2011). The result from the experiment of analyzing the resistance of planktonic bacteria vs the biofilm were consistent to certain extent. From the experiment is it quiet evident that the number of dead cells in the control is less than the treated bacteria and this is because not all the bacteria have resistance to the antibiotic to which they are exposed. However, in the third comparative analysis where the number of dead bacteria in the biofilm control are more than the dead bacteria in the treated biofilm, there is some form of laboratory error that has led to wrong observations. The most common error is the wrong way of handling the samples and invading the sterile environment that is required for proper growth of the bacteria. Another most common error is that of accurate pipetting and media preparation. The pipetting error is often observed when the medium for plating is prepared or the inoculum is transferred on the plate. There are other possible errors that could have hampered the positive outcome of the results, like the use of wrong culture volumes, error in the serial dilution, etc (Schofield, C. 2006).
Resistance Capacity of Biofilms vs. Planktonic Cells
Analysis:
Serial dilution
Practical 1 – Result of no of colonies counting
|
Dilution |
No. of colonies |
Concentration of bacteria (CFU ml-1 ) |
|
10-9 |
0 |
0 |
|
10-8 |
0 |
0 |
|
10-7 |
4 |
4 x 10⁸ |
|
10-6 |
10 |
1 x 10⁸ |
|
10-5 |
133 |
1.33 x 10⁸ |
The formula used for the calculation of the concentration of bacteria is:
Number of bacteria = (CFUs on plate (e.g. 27)/ CFUs ml-1 volume plated (e.g. 0.1 ml))
x Dilution factor (e.g. 1 x 10⁵)
The PGLO plasmid that is used for the transformation, codes for two genes. One gene produces the GFP protein that gives the inherent green fluorescent glow to the organism and the second gene produces resistance to ampicillin (Blaber, M. 2004). If the genetically transformed cells survive the antibiotic ampicillin, we can infer that the process of transformation has been successful and the genes from the plasmid have been transferred into the cells.
The effect of Ampicillin on E coli cells is such that it penetrates through the outer wall of the gram negative bacteria and inhibits transpeptidase, which aids in formation of bacterial cell wall and eventually causes the lysis of the cell (Lawrence, K and Anthony, M 2013). Therefore, the normal (untransformed) cells of E coli are not resistant to ampicillin. So when, after transformation, the cells are grown on LB agar plate containing the antibiotic, only those cells survive and form colonies that have the gene which is resistant to ampicillin. And this can happen only when the transformation has been successful and the gene encoding the resistance against ampicillin has been transferred into the genome of the E. coli cells.
What’s glowing?
When the UV rays were shined on the negative pGLO plasmid DNA, there was nothing visible and thus, no significant change or observation was recorded. But when the UV rays were shined on positive pGLO plasmid DNA, the colonies of cells appeared in fluorescent green color. This concluded that the protein encoded by the GFP (Green fluorescent protein gene) was being expressed in the cells and because of this expression there was a characteristic green color.
There are two sources of fluorescence that can be eliminated- the pGLO plasmid DNA and the original bacterial cells.
From the result, it can be concluded that the source of fluorescence is the presence of the pGLO plasmid DNA. The pGLO plasmid produces a protein that encoded by the Green fluorescent protein gene. Expression of this protein gives the characteristic green color to the cells.
The experiment was successful to a certain extent. The (+) LB/amp/ara plate contained a number of colonies of cells, which when exposed to the UV rays, fluoresced. On the contrary, the (-) LB/ amp/ ara plates contained no colonies. This concluded that the colonies in the former case were the transformed bacteria that had incorporated the GFP gene and the antibiotic resistant gene (derived from the pGLO plasmid). While in the latter case, the transformation was not successful and hence, the original bacterial cells did not survive in the presence of the antibiotic ampicillin. However, negative results were obtained on the (-) LB/amp plate and these colonies glowed under the UV light. Moreover, there were no signs of any colonies on the (+) LB/Amp plate, which was a negative result. Probably, the transfer of the colonies via loop on the plate was error prone and this might have led to loss of accurate data.
The interaction between genes and environment
No, it is practically not possible to determine and conclude about the bacteria being ampicillin resistant, simply by looking at them. This is because both, the non resistant bacteria as well as the ampicillin resistant bacteria.However, the comparison can be done by viewing the number of colonies on the two plates- one lacking the gene of ampicillin resistance (-pGLO LB plate) and the other with the gene for ampicillin resistance (+pGLO LB plate). The number of colonies on the +pGLO LB plate determine the number of bacteria that are resistant to ampicillin, while the number of colonies on the –pGLO LB plate determine the number of bacteria that are not resistant to ampicillin.
The environment of the bacteria was changed by adding ampicillin to LB plate. The bacteria that were resistant to ampicillin grew on this plate while the non resistant ones, were killed.
To see the bacterial cells glow green, one of the factors that need to be present is the sugar arabinose in the agarose plate. The transformed cells appear white on the plates containing arabinose. Another factor contributing to the fluorescence of the bacterial cells is the UV light, which when falls of the GFP protein, excites the protein to emit a fluorescent glow and thereby appear fluorescent green in color.
The arabinose sugar helps in turning on the expression of the GFP or the green fluorescent protein by binding to the regulatory protein that resides on the promoter region (Desai, T and Rao, C 2010). When the binding between arabinose sugar and the regulatory protein occurs, there is change of shape and this facilitates the transcription of gene by the RNA polymerase.
The major advantage for any organism, if it is capable of turning on or off a particular gene, is that the genes can adapt to different conditions and thus, prevent the overproduction of the unnecessary proteins.
Transformation efficiency calculation
Total number of green fluorescent colonies growing on the LB/ amp/ ara plate= 240
Total number of pGLO plasmid DNA in the bacterial cells spread on the LB/amp/ara plate=
1 μl= 0.08 μg
10 μl= 0.08 x 10 = 0.8 μg of DNA
Fraction of DNA used = 100/510 = 0.1961
pGLO DNA spread in μg= 510 x 0.1961 = 99.99 μg
Transformation efficiency:
No. of colonies on LB/amp/ara plate= 227
Microgrmas of DNA spread on the plates= 0.16
Transformation efficiency= 1.4 x 10³
References:
Blaber, M, 2004, Lecture 7: Genetic transformation (using bacteria and the pGLO plasmid), BCH 4053L Biochemistry lab, viewed on 18th April 2015, https://www.mikeblaber.org/oldwine/BCH4053l/Lecture07/Lecture07.htm.
Desai, T and Rao, C, 2010, Regulation of arabinose and Xylose metabolism in Escherichia coli, appl. Environ. Microbiol., Vol. 76, no. 5, pp: 1524-1532.
Ranjan Laboratories, 2008, Pseudomonas fluorescens, viewed on 29th April 2015, https://www.drrajanlaboratories.com/product1.html.
Emerson, D, Agulto, L, Liu, H and Liu, L, 2008, identifying and characterizing bacteria in an era of genomics and proteomics, Bioscience, Vol. 58, no. 10, pp: 925-936.
Gudina et al., 2012, Isolation and study of microorganisms from oil samples for application in Microbial Enhanced Oil Recovery, international biodeterioration & biodegradation, Vol. 68, pp: 55-64.
Lawrence, K and Anthony, M, 2013, The effects of Ampicillin on the growth of Escherichia coli, North Carolina State University.
Moran, M, reisch, C, kiene, R and Whitman, W., 2012, Genomic insights into bacterial DMSP transformations, Annual review of Marine science, Vo. 4, pp: 523-542.
Mueller, K., 2013, E. coli knows how to win, Sci. Signal, Vol. 6, no. 262, pp: ec40.
Paraje, M., 2011, antimicrobial resistance in biofilms, Science against microbial pathogens: communicating current research and technological advances, Formatex.
Relman, D., 2012, Microbiology: learning about who we are, Nature, Vol. 486, pp: 194-195.
Schofield, C., 2006, Preventing errors in the microbiology lab, Cover story.
Tortura, P, Funke, B and Case, C, 2013, Microbiology: An introduction, Pearson.
To export a reference to this article please select a referencing stye below:
My Assignment Help. (2016). Genetic Transformation In Microorganisms: An Essay. Retrieved from https://myassignmenthelp.com/free-samples/genetic-transformation.
"Genetic Transformation In Microorganisms: An Essay." My Assignment Help, 2016, https://myassignmenthelp.com/free-samples/genetic-transformation.
My Assignment Help (2016) Genetic Transformation In Microorganisms: An Essay [Online]. Available from: https://myassignmenthelp.com/free-samples/genetic-transformation
[Accessed 07 June 2025].
My Assignment Help. 'Genetic Transformation In Microorganisms: An Essay' (My Assignment Help, 2016) <https://myassignmenthelp.com/free-samples/genetic-transformation> accessed 07 June 2025.
My Assignment Help. Genetic Transformation In Microorganisms: An Essay [Internet]. My Assignment Help. 2016 [cited 07 June 2025]. Available from: https://myassignmenthelp.com/free-samples/genetic-transformation.