
Histogram of Rural Per Capita Income of Indian States
Question:
Describe the descriptive statistical,relationship between education & poverty and hypothesis testing?
The document presents some statistical analysis based on data (presented in Appendix). The basic assumption taken for the task is that there should be some amount of relationship between education, poverty and per capita income. The more educated a society would be there would be higher chances of poverty alleviation. Such a place would have higher per capita income, even though here might be other factors influencing the same.
The section would investigate the nature of data with the statistical measures and graphs showing different attributes. This would help reader to understand the variations or symmetry in the data sets.
The rural per capita income of the Indian States has been shown in this section with the help of histogram. The histograms are the bar charts which show the variation in the range of data. The frequency along the vertical axis shows that the number of observations which fall in a particular range, which is plotted along the horizontal axis. The range of data (like per capita income) can be controlled according to the differences between the higher and lower values and the number of points required.
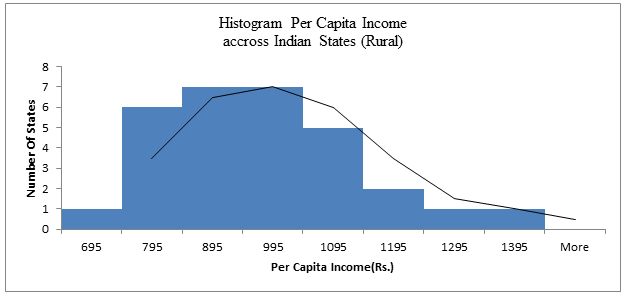
The following histogram plot is more skewed towards he lower ranges of data (per capita income). This means that there more states with lower per capita income while lesser number of states with per capita income above the mean. In the following graph we may see that there are 7 states each in the per capita ranges of Rs. 895 to Rs. 995 and Rs. 995 to Rs.1095. While there are only one states each in the per capita ranges of Rs. 1195 to Rs. 1295 and Rs. 1295 to Rs.1395.
The data in the below table, shows the statistical details of the per capita income in the rural areas across the Indian states. The mean per capita income is Rs. 928.73. This simply means that among the states this is the average value of the per capita income. The next value is the median which is Rs. 903.5 which is he value exactly in the middle of all data. The Mode is the data which has the highest frequency, here it is Rs. 930. The standard deviation of the data, 152.53, shows that there is high grade of variation.
The low value of kurtosis shows that the distribution is quite close to the normal distribution. While the high skewness of data(0.77) shows that the data is asymmetric as has been discussed above.
|
Per Capita Income Rural Areas in Indian States |
|
|
Mean |
928.7333 |
|
Standard Error |
27.84889 |
|
Median |
903.5 |
|
Mode |
930 |
|
Standard Deviation |
152.5347 |
|
Sample Variance |
23266.82 |
|
Kurtosis |
0.2438 |
|
Skewness |
0.772504 |
|
Range |
606 |
|
Minimum |
695 |
|
Maximum |
1301 |
|
Sum |
27862 |
|
Count |
30 |
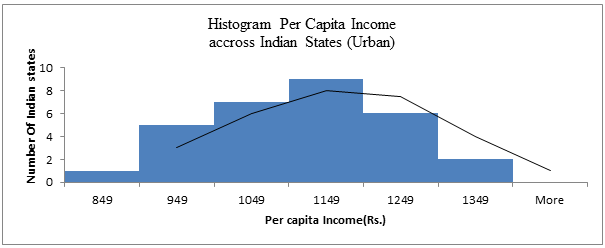
Similar to the plot of rural area per capita income, we obtain the histogram for the urban per capita income. In the following chart we see an opposite trend of the per capita income for urban areas with respect to per capita income in the rural areas. The incomes are more skewed towards the higher income. This means more number of Indian states can be found with higher per capita incomes than those with lower per capita incomes.
Statistics of Per Capita Income in Rural Areas
Another feature of the following plot is that the per capita income of the urban areas is somewhat higher than the rural area and the spread of the following graph is lesser than the previous one. This means there are lesser extremes in per capita across the Indian saes in urban areas than the rural areas.
The vital statistics for per capita income has been presented in the below table. The mean of per capita income is Rs. 1059.97. This is significantly higher than the mean per capita income of the rural areas. The median value is Rs. 1062, which simply means that half of the states would have per capita income higher than the value while have of the states, would have per capita income lower than the given value.
The mode for the data sets is Rs. 1134, which is again quite higher than the per capita income of the rural counterpart. The standard deviation of the data is high (119.27) but lower than the value of rural area for per capita income. The skewness value is very low which points towards the symmetric distribution of the data. Similarly the value for kurtosis is quite low.
|
Per Capita Income Urban Areas in Indian States |
|
|
Mean |
1059.967 |
|
Standard Error |
21.77716 |
|
Median |
1062 |
|
Mode |
1134 |
|
Standard Deviation |
119.2784 |
|
Sample Variance |
14227.34 |
|
Kurtosis |
-0.39729 |
|
Skewness |
0.202935 |
|
Range |
460 |
|
Minimum |
849 |
|
Maximum |
1309 |
|
Sum |
31799 |
|
Count |
30 |
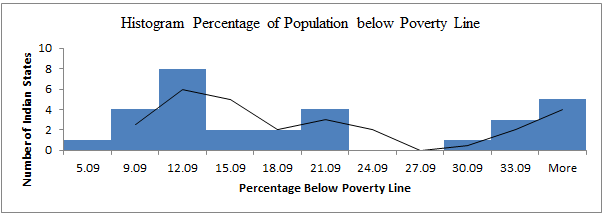
The histogram for the percentage of population below poverty line is quite different from the above plots as the plot below is not continuous and is bimodal distribution. This means that there are some states where the poverty line is lower while that are few states where the poverty line is quite higher (in terms of percentages).
There are as many as 8 states where the percentage of population below poverty line is ranges from 12.09% to 15.09%. There are 4 states where the percentage of population below poverty line is higher than 33.09%.
The mean percentage value for the people above poverty line is 19.07%. The value of mean poverty line is quite high. The median value is about 15.67%, which represent the middle value for the percentages above and below. The standard deviation of the data is low (10.95). The value of kurtosis is very high, this means that the distribution cannot be represented as a normal distribution.
|
Percentage of Population of states below Poverty line |
|
|
Mean |
19.07067 |
|
Standard Error |
2.000949 |
|
Median |
15.67 |
|
Mode |
#N/A |
|
Standard Deviation |
10.95965 |
|
Sample Variance |
120.1139 |
|
Kurtosis |
-1.15449 |
|
Skewness |
0.604081 |
|
Range |
34.84 |
|
Minimum |
5.09 |
|
Maximum |
39.93 |
|
Sum |
572.12 |
|
Count |
30 |
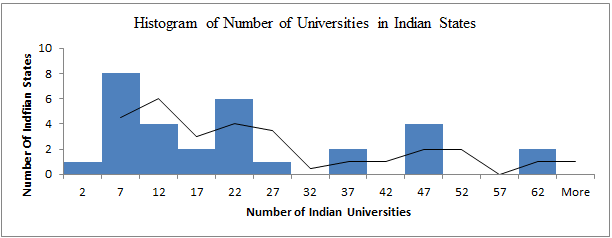
Similar to the plot of percentage of population, below chart shows the number of Universities across the states. The graph is not continuous and the less number of Universities are more prevalent across the states. Few states are there which have number of Universities in the range of 57 to 62, while there are around 8 states with 7 to 12 Universities.
The descriptive statistics show that the values in the following table. The mean for the number of Indian Universities is around 20. This is quite low figure for a country with large population. The median value is 17.5 which is close o the mean value. The mode value is surprisingly very low. The standard deviation is quite large comparing with the mean value. Even though the kurtosis is very low the histogram plot is hardly a normal plot.
|
Number of Indian Universities |
|
|
Mean |
20.53333 |
|
Standard Error |
3.174877 |
|
Median |
17.5 |
|
Mode |
3 |
|
Standard Deviation |
17.38952 |
|
Sample Variance |
302.3954 |
|
Kurtosis |
-0.325 |
|
Skewness |
0.869304 |
|
Range |
57 |
|
Minimum |
2 |
|
Maximum |
59 |
|
Sum |
616 |
|
Count |
30 |
We would try to find out if there is any relationship between the education and poverty. We would start with the assumption that education helps in uplifting population above the poverty line.
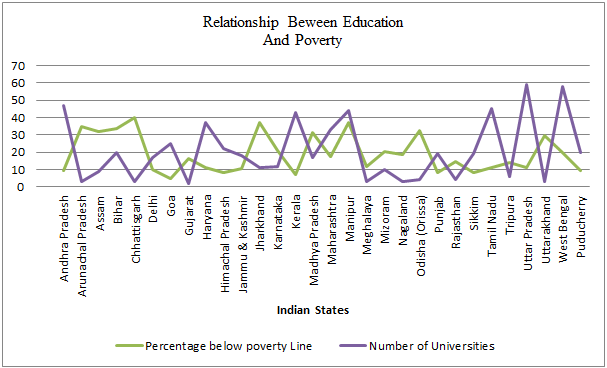
In the above graph we have plotted the data of Universities and the data for poverty together. Since there is an inverse relationship between education and poverty, we see that both the curves are inverted with respect to each other, (like mirror images). The states with higher number of Universities should have less poverty percentage for the population.
The below tables show the regression values as calculated with help of excel. Multiple R value is very low; this means that here is very little correlation between the two data. This is again shown by the R square value which is very low (0.11). This is quite understandable result as we can see from the above plot that there is quite inverse relationship between the data. We see that both the curves are inverted with respect to each other, (like mirror images).
|
SUMMARY OUTPUT |
||||||||
|
Regression Statistics |
||||||||
|
Multiple R |
0.331764 |
|||||||
|
R Square |
0.110068 |
|||||||
|
Adjusted R Square |
0.078284 |
|||||||
|
Standard Error |
10.52192 |
|||||||
|
Observations |
30 |
|||||||
|
ANOVA |
||||||||
|
|
df |
SS |
MS |
F |
Significance F |
|||
|
Regression |
1 |
383.3986 |
383.3986 |
3.463062 |
0.073285 |
|||
|
Residual |
28 |
3099.905 |
110.7109 |
|||||
|
Total |
29 |
3483.303 |
||||||
|
|
Coefficients |
Standard Error |
t Stat |
P-value |
Lower 95% |
Upper 95% |
Lower 95.0% |
Upper 95.0% |
|
Intercept |
23.36403 |
3.002185 |
7.782345 |
1.77E-08 |
17.21434 |
29.51373 |
17.21434 |
29.51373 |
|
X Variable 1 |
-0.20909 |
0.112359 |
-1.86093 |
0.073285 |
-0.43925 |
0.021065 |
-0.43925 |
0.021065 |
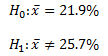
The poverty percentage for the last year was 21.9% for the whole country. Let us check whether the poverty decreased with respect to the previous year. Let us take the statement for the hypothesis as follows:
We would use the student test to confirm whether the hypothesis can be rejected. The test is generally used in case of a small size sample.
The t value can be calculated using the following formula.
![]()
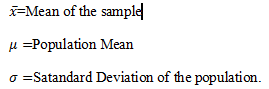
We would now calculate the t-value as -0.03297. The value from the t-table of corresponding is 0.127 (with 0.9). Thus, we can reject null hypothesis.
This shows that there is a decrease in the poverty level form the previous year.
Conclusion
The data (as can be found in the appendix) shows different variables like per capita income of the rural and urban areas, the poverty level and Number of Universities of Indian States. The data suggest the variation of urban area is quite less as compared with the rural areas. There lower limit of the per capita income of the urban area is quite less than the rural areas. The distribution for the per capita income of both the rural and urban areas is skewed but normal.
There should be some measurement to calculate the inverse dependence of the variables. The poverty and education has very inverse relationships, which is only partly proved by the regression analysis. The hypothesis test proves that there has been a decline in the poverty levels as compared with the previous years.
https://maps.unomaha.edu/. Week 3: Linear regression. https://maps.unomaha.edu/maher/GEOL2300/week3/week3.html (accessed January 10, 2015).
Kean University. Regression and Correlation. https://www.kean.edu/~fosborne/bstat/09rc.html (accessed Jan 15, 2015).
Stockburger, David W. Introductory Statistics: Concepts, Models, and Applications: REGRESSION MODELS. https://www.psychstat.missouristate.edu/introbook/sbk16.htm (accessed Janurary 18, 2015).
Huff, D. (1993). How to Lie with Statistics. W. W. Norton & Company.
James, G. (2013). An Introduction to Statistical Learning: with Applications in R (Springer Texts in Statistics). Springer.
|
Indian States |
Per capita Income |
Percentage below poverty Line |
Number of Universities |
|
|
Rural |
Urban |
|||
|
Andhra Pradesh |
860 |
1009 |
9.2 |
47 |
|
Arunachal Pradesh |
930 |
1060 |
34.67 |
3 |
|
Assam |
828 |
1008 |
31.98 |
9 |
|
Bihar |
778 |
923 |
33.74 |
20 |
|
Chhattisgarh |
738 |
849 |
39.93 |
3 |
|
Delhi |
1145 |
1134 |
9.91 |
17 |
|
Goa |
1090 |
1134 |
5.09 |
25 |
|
Gujarat |
932 |
1152 |
16.63 |
2 |
|
Haryana |
1015 |
1169 |
11.16 |
37 |
|
Himachal Pradesh |
913 |
1064 |
8.06 |
22 |
|
Jammu & Kashmir |
891 |
988 |
10.35 |
18 |
|
Jharkhand |
748 |
974 |
36.96 |
11 |
|
Karnataka |
902 |
1089 |
20.91 |
12 |
|
Kerala |
1018 |
987 |
7.05 |
43 |
|
Madhya Pradesh |
771 |
897 |
31.65 |
17 |
|
Maharashtra |
967 |
1126 |
17.35 |
33 |
|
Manipur |
1118 |
1170 |
36.89 |
44 |
|
Meghalaya |
888 |
1154 |
11.87 |
3 |
|
Mizoram |
1066 |
1155 |
20.4 |
10 |
|
Nagaland |
1270 |
1302 |
18.88 |
3 |
|
Odisha (Orissa) |
695 |
861 |
32.59 |
4 |
|
Punjab |
1054 |
1055 |
8.26 |
19 |
|
Rajasthan |
905 |
1002 |
14.71 |
4 |
|
Sikkim |
930 |
1226 |
8.19 |
19 |
|
Tamil Nadu |
880 |
937 |
11.28 |
45 |
|
Tripura |
798 |
920 |
14.05 |
6 |
|
Uttar Pradesh |
880 |
1082 |
11.26 |
59 |
|
Uttarakhand |
768 |
1082 |
29.43 |
3 |
|
West Bengal |
783 |
981 |
19.98 |
58 |
|
Puducherry |
1301 |
1309 |
9.69 |
20 |
To export a reference to this article please select a referencing stye below:
My Assignment Help. (2016). Statistical Analysis Of Education, Poverty, And Per Capita Income In Indian States: An Essay.. Retrieved from https://myassignmenthelp.com/free-samples/statistical-case-analysis.
"Statistical Analysis Of Education, Poverty, And Per Capita Income In Indian States: An Essay.." My Assignment Help, 2016, https://myassignmenthelp.com/free-samples/statistical-case-analysis.
My Assignment Help (2016) Statistical Analysis Of Education, Poverty, And Per Capita Income In Indian States: An Essay. [Online]. Available from: https://myassignmenthelp.com/free-samples/statistical-case-analysis
[Accessed 31 May 2025].
My Assignment Help. 'Statistical Analysis Of Education, Poverty, And Per Capita Income In Indian States: An Essay.' (My Assignment Help, 2016) <https://myassignmenthelp.com/free-samples/statistical-case-analysis> accessed 31 May 2025.
My Assignment Help. Statistical Analysis Of Education, Poverty, And Per Capita Income In Indian States: An Essay. [Internet]. My Assignment Help. 2016 [cited 31 May 2025]. Available from: https://myassignmenthelp.com/free-samples/statistical-case-analysis.