
The Chosen Companies and their Backgrounds
Discuss about The Importance of Financial Ratio Analysis to an Investor.
Ratios are the basis in which all businesses in the world can be evaluated. The story provided by the financial ratios is derived from the financial statements which are of three general types; the income statement, cash flow statement, and the balance sheet. This provides information that helps in determining the weaknesses, strengths and the forecasting of the future performance of any business. Also, the historical performance of a firm is derived.
Financial statements of any business that is listed on the US stock exchange are available online. This report will begin by choosing two companies from the three suggested. After making the choice, the past financial statement will be accessed from the internet. The suggested analysis is suggested to be for three past years. Hence, only financial statements for these years will be downloaded. These are the statements that will provide the figures that will be used in the calculations of various ratios. The financial ratios are used in ratio analysis (Denny, 2003). Formulas for calculating the ratios will be provided.
After the calculation of the ratios, interpretations based on the UK standard will be done. The calculation is just the first step and therefore without the interpretation and comparison, the analysis will not be complete. It is from the interpretations that the comparison between the two companies will be made. Different accounting standards fix certain levels of ratio results. The report will seek to establish the desirable level of every ratio calculated. They are fixed in a way that every result above the fixed level is desirable, and any result below that level is undesirable.
Conclusions concerning the ratios will be made and the best company will be noted. Suggestions as to why one of the companies is better than the other will be provided along with the interpretations. The importance of ratio is evident in ratio analysis, but there are demerits which limit their effectiveness. These demerits will be drawn. Recommendations will be provided at the end of the report.
According to Oshoke & Sumaina (2015), Financial ratios are designed to help evaluate financial statements. The evaluation is for performance measurement for comparisons (benchmarking) with other firms in the industry or period of performance of a firm. There are various categories of ratios which are used to evaluate the performance of a firm.
Profitability Ratios
The two companies that will be compared in this report are BT Group Plc and BskyB Plc. The two companies are leading communication companies in the UK. This is, therefore, a comparison of businesses from the same industry (same line of business). BT is the oldest communication company in the world. It is well established worldwide serving over 170 countries. The BT Group Plc was formed to be a holding company for the initially existing company British Telecommunications plc formed in 1984. Its formation was in 2001. BSkyB’s growth to become a larger entertainment formats provider was accelerated by the investment in the newly introduced technology. The lack of technology is what facilitated its formation when two companies made losses and decided to merge (the British Satellite Broadcasting and Sky Television Plc). This was back in 1990 (Referenceforbusiness.com, 2016).
Denny (2003) noted that the main aim of profitability ratios is to determine whether the business is using its resources effectively. The primary role of profitability analysis according to Koen and Oberholster (1999) is to determine the profitability level, factors limiting profitability, factors contributing to a change in profitability and using the identified solution to eliminate deficiencies. There are however other objectives of this analysis. This ratio is also related to the operation efficiency (Robinson et al., 2015). The more efficient, the higher the profitability.
For every profitability ratio obtained from the calculations, a greater profitability is represented by the highest ratio. The ratios calculated to gauge the business profitability includes.
ROCE = [PBIT / (Non-Current Liabilities + Equity)] * 100
Operation Profit Margin= [PBIT/Sales] * 100
Net Profit Margin= [Net Profit/Sales] * 100
BT Group Plc BSkyB Group Plc
|
2013 |
2014 |
2015 |
2013 |
2014 |
2015 |
|
|
PBIT |
3338 |
3145 |
3480 |
1291 |
1161 |
972 |
|
NCL |
17537 |
17803 |
18675 |
3016 |
2858 |
7930 |
|
Equity |
-262 |
-592 |
808 |
1012 |
1072 |
3165 |
|
ROCE |
19.32 |
18.27 |
17.86 |
32.05 |
29.54 |
8.76 |
The profit, in this case, is expressed as a percentage and in relation to the employed capital. It is therefore used in measuring the firm size. This ratio should be as high as possible. A lower ratio indicates low profitability, a negative ratio represents losses, but a high ratio indicates huge profits. Firms in the UK operates in different sectors, and the range of ROCEs falls between 5 % and 15 % (The Student Room, 2016). The BSkyB Group Plc is better off than the BT Group Plc in the year 2013 and 2014. The ROCEs for both are indicating a falling trend as shown in the graph below;

Fig 1.1: ROCE
However, the falling trend is worse for the BSkyB Group Plc. This make BT be better off in 2015.
Interpretation of Profitability Ratios
BT Group Plc BskyB Group Plc
|
2013 |
2014 |
2015 |
2013 |
2014 |
2015 |
|
|
PBIT |
3338 |
3145 |
3480 |
1291 |
1161 |
972 |
|
Sales |
18253 |
18287 |
17979 |
7235 |
7632 |
9989 |
|
OPM |
18.29 |
17.20 |
19.36 |
17.84 |
15.21 |
9.73 |
The OPM for both groups fell in the year 2014. That for BT group later rose in 2015, but that for BSkyB Group continued falling. This made BT Group best for the investors than the BSkyB.
The trend for the changes in OPM is shown in the graph below;

Fig 1.2: OPM
BT Group Plc BskyB Group Plc
|
2013 |
20144 |
2015 |
2013 |
2014 |
2015 |
|
|
NP |
2088 |
2018 |
2135 |
979 |
865 |
1952 |
|
Sales |
18253 |
18287 |
17979 |
7235 |
7632 |
9989 |
|
NPM |
11.44 |
11.04 |
11.87 |
13.53 |
11.33 |
19.54 |
Under this ratio, net profit is compared to the sales revenue. It is expressed as a percentage and shows the amount of net profits resulting from sales. BSkyB group has a higher NPM and, therefore, it is considered more profitable than BT group. Their NPM fell in 2014 but later in 2015 there was an increase, however, the increase for BSkyB group was very high. The fall in the net profit margin could be caused by operating strategies of a firm, external factors such as rapid completion which pushes the price down or some major factors beyond the control of the firm (or rather the whole industry since both experienced the reduction in 2014). The trend for the changes in the NPM for the two businesses is shown in the graph below;

Fig 1.3: NPM
A liquid asset is one trading in an active market and hence can be quickly converted into cash at the ongoing market price (Mayes and Shank, 2007). The firms’ liquidity ratio deals with the question if the firm is able to pay off its current debt given its current asset. Cash budgets are used in carrying out a full liquidity analysis, but by relating to the amount of cash and other current assets to the current obligations. It is easy to determine if the firm is liquid enough to pay the current obligation. The two liquidity ratios normally used are;
Current Ratio= Current Assets/Current Liabilities
Quick Ratio= (Current Assets – Inventory)/ Current Liabilities
The Fixed Assets Turnover calculated as (Turnover/ Non-Current Assets) is a measure of efficiency.
It includes cash marketable securities account receivables (debtors) and inventories (stock). Current liabilities include account payables short term loans (overdrafts) accrued taxes and other accrued expenses. A ratio of two and above is preferable however over the period, if the trend is going down then it means that the company is getting into financial difficulties. A ratio of two according to Hendy (2011) indicate that the current assets are enough to pay any current liability that becomes due.
BT Group Plc BSkyB Group Plc
|
2013 |
2014 |
2015 |
2013 |
2014 |
2015 |
|
|
CA |
4621 |
5706 |
7471 |
2569 |
2573 |
4559 |
|
CL |
7551 |
7687 |
7708 |
2317 |
2519 |
4204 |
|
CURRENT |
0.61 |
0.74 |
0.97 |
1.11 |
1.02 |
1.08 |
Both companies have a current ratio that is below the preferable level. BSkyB group has a higher current ratio as compared to BT group. However, the trend for BT group is rising while that of BSkyB is falling. This means that it was facing some financial difficulties in 2014. This make BT more preferred as the prospective, current ratio is expected to rise. The trend for the changes in current ratio for both companies is as shown below;
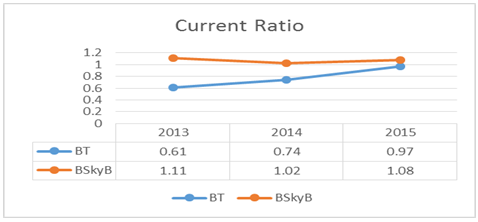
Fig 1.4: Current Ratio
Inventories are typically the least liquid of the firm’s current assets. Hence, they are the current assets on which losses of the firm are most likely to occur. This ratio gives the measure of firm’s ability to pay off short-term obligations without relying on the sale of inventories. High levels of liquidity are represented by a ratio of one (nibusinessinfo.co.uk, 2016). A solid financial health is the interpretation of such an indicator.
BT Group Plc BSkyB Group Plc
|
2013 |
2014 |
2015 |
2013 |
2014 |
2015 |
|
|
CA |
4621 |
5706 |
7471 |
2569 |
2573 |
4559 |
|
Inventory |
103 |
82 |
94 |
548 |
546 |
847 |
|
CL |
7551 |
7687 |
7708 |
2317 |
2519 |
4204 |
|
QUICK |
0.60 |
0.73 |
0.96 |
0.87 |
0.80 |
0.88 |
Both Groups have a ratio of less than one, therefore making them be determined as having a weak financial health. The quick ratio for BT group is portraying a constant rising trend while the trend for BSkyB Group is rising but not constant. The fact that it’s not constant creates some possibility of falling and, therefore, investors will prefer BT to BSkyB group. Furthermore, the ratio of BT is almost hitting the required level of 1:1 according to the (Accaglobal.com, 2016). The trend of the change in the quick ratio for both companies is as shown in the following graph.

Fig 1.5: Quick Ratio
This ratio measures the degree in which a fixed asset is used in the generation of sales. The more the number of times the better. This relation can be raised by delaying the duration of replacement of the fixed long-term assets (Mayes and Shank, 2007). Holding all other factors constant, the net fixed asset of a firm will reduce as the accumulated depreciation increases.
BT Group Plc BSkyB Group Plc
|
2013 |
2014 |
2015 |
2013 |
2014 |
2015 |
|
|
Sales |
18253 |
18287 |
17979 |
7235 |
7632 |
9989 |
|
NCA |
20205 |
19192 |
19483 |
3776 |
3876 |
10799 |
|
FAT |
0.90 |
0.95 |
0.92 |
1.92 |
1.97 |
0.92 |
BT Group has a constant FAT trend while BSkyB has a falling trend. The trend is as shown in the following graph. In 2013 and 2014, an investor would be attracted to investing in BSkyB Group but in 2015 would be indifferent. Based on this ratio, BSkyB is better.

Fig 1.6: Fixed Asset Turnover
Asset valuation is carried out in different methods by various organizations. There are three methods for this valuation, they are; first in first out (FIFO), Last in last out (LIFO) and the average cost method. The value of the closing stock provided by these three methods is different. Therefore, comparison of the performance of companies on this basis can, therefore, result in some misleading information.
Ratio analysis cannot be used in companies of the same industry or different industries because the complete picture of the companies is never indicated by a set of accounts. However, given the international financial standards of reporting, then a comparison of the ratios of the firm can be compared with other industries.
Ratio analysis can be affected by seasonal factors because their computation is based on the final figure only ignoring the seasonal fluctuations which arise from sales and other operations. Ratios differ across countries, and therefore, they cannot be used between countries. Countries have different standards, and therefore, ratios are defined differently.
Conclusion
When the results of the ratio analysis are below the fixed level for desirability, it is an indicator that the company is performing poorly. Some companies may be having ratios that are above the desirable level but still be different in desirability. This depends on the magnitude in which they exceed the fixed level ( for instance if the fixed level for a certain ratio is 2, then if an analysis for company A and B gives a result for the same ratio as 2.4 and 2.9 respectively, then B is better than A).
Calculation of ratios for a single period may be of less importance to the business. It is only useful when compared to that of other companies and when compared with that of the same ratio calculated for the past periods. An increase in the ratio is an indicator that the business performance is improving. Historical data is used in the ratio analysis.
Based on the profitability ratios analyzed, the BT Group Plc proofs to be more profitable than the BSkyB group Plc. When accounting for liquidity ratios, both the current and the quick ratios are analyzed. However, the best analysis should be based on the quick ratio as it considers the fact that the current asset may be in excess of stock, and, therefore, it eliminates stock in its calculation.
Ratios below the fixed level mean that the company has to focus on improving its performance by implements certain courses of actions. Poor performance cannot be used to predict a healthy growth in the future. So, whenever one wants to determine whether the growth of the company is taking the right direction, desirable level of ratios will serve this purpose.
There is a possibility that current asset may include a large proportion of stock, this may provide a misleading analysis if the current ratio is used. I would, therefore, recommend the use of quick ratio to avoid such an incidence.
The ratios used in the formulation of this report are just some of the mostly used ratios. There are however other ratios that require to be analyzed as different ratios have different meanings. In doing the ratio analysis, I would recommend that it be done on only companies that are of the same size as this would provide a more accurate comparison. Large companies have advantages over smaller companies making the ratio analysis between then to be unreliable.
The management should consider all the rations before making any internal decision. They will help in making proper decisions that will contribute to a desirable business growth in the future. It will help in maintaining the financial health of a firm and also its profitability.
Accaglobal.com. (2016). Ratio analysis | ACCA Qualification | Students | ACCA Global. [Online] Available at: https://www.accaglobal.com/an/en/student/exam-support-resources/fundamentals-exams-study-resources/f2/technical-articles/ratio-analysis.html [Accessed 23 Mar. 2016].
Anon, (2016). [Online] Available at: https://www.btplc.com/Sharesandperformance/Annualreportandreview/pdf/2014_BT_Annual_Report.pdf [Accessed 20 Mar. 2016].
Anon, (2016). [Online] Available at: https://corporate.sky.com/documents/publications-and-reports/2013/annual-report-2013.pdf [Accessed 20 Mar. 2016].
Anon, (2016). [Online] Available at: https://corporate.sky.com/investors/annual-report-2014 [Accessed 20 Mar. 2016].
Anon, (2016). [Online] Available at: https://corporate.sky.com/investors/annual-report-2015 [Accessed 20 Mar. 2016].
Anon, (2016). [Online] Available at: https://www.btplc.com/Sharesandperformance/Annualreportandreview/pdf/2013_BT_Annual_Report_smart.pdf [Accessed 20 Mar. 2016].
Btplc.com. (2016). Annual reports 2015. [Online] Available at: https://www.btplc.com/Sharesandperformance/Annualreportandreview/ [Accessed 20 Mar. 2016].
Crozierjones.co.uk. (2016). Common accounting ratios for measuring Business Performance. [Online] Available at: https://www.crozierjones.co.uk/WebPage/eQEAAA/Common-accounting-ratios-for-measuring-Business-Performance.aspx?GS=4&PT=2 [Accessed 23 Mar. 2016].
Denny, R. (2003). Accounts for solicitors. London, U.K.: Cavendish Pub.
Hendy, P. (2011). Key accounting ratios for measuring business performance. [Online] PAH Accountants. Available at: https://wiltshireaccountants.co.uk/accounting-ratios-measuring-a-business/ [Accessed 23 Mar. 2016].
Koen, M. and Oberholster, J. (1999). Analysis and interpretation of financial statements. Kenwyn: Juta.
Mayes, T. and Shank, T. (2007). Financial analysis with Microsoft Excel. Mason, OH: Thomson/South Western.
nibusinessinfo.co.uk. (2016). Use accounting ratios to assess business performance. [Online] Available at: https://www.nibusinessinfo.co.uk/content/use-accounting-ratios-assess-business-performance [Accessed 23 Mar. 2016].
Oshoke, A., and Sumaina, J. (2015). Performance Evaluation through Ratio Analysis. Journal of Accounting and Finance Management, Vol. 1 No. 3. Retrieved from https://www.iiardonline.org/journals/jafm/PERFORMANCE%20EVALUATION.pdf
Referenceforbusiness.com. (2016). British Sky Broadcasting Group Plc - Company Profile, Information, Business Description, History, Background Information on British Sky Broadcasting Group Plc. [online] Available at: https://www.referenceforbusiness.com/history2/88/British-Sky-Broadcasting-Group-Plc.html [Accessed 23 Mar. 2016].
Robinson, T., Henry, E., Pirie, W. and Broihahn, M. (2015). International financial statement analysis.
The Student Room. (2016). Revision: A Level Accounts Module 4 - Ratio Analysis - The Student Room. [Online] Available at: https://www.thestudentroom.co.uk/wiki/Revision:A_Level_Accounts_Module_4_-_Ratio_Analysis#Return_on_capital_employed [Accessed 23 Mar. 2016].
To export a reference to this article please select a referencing stye below:
My Assignment Help. (2017). The Importance Of Financial Ratio Analysis To An Investor. Retrieved from https://myassignmenthelp.com/free-samples/the-importance-of-financial-ratio-analysis-to-an-investor.
"The Importance Of Financial Ratio Analysis To An Investor." My Assignment Help, 2017, https://myassignmenthelp.com/free-samples/the-importance-of-financial-ratio-analysis-to-an-investor.
My Assignment Help (2017) The Importance Of Financial Ratio Analysis To An Investor [Online]. Available from: https://myassignmenthelp.com/free-samples/the-importance-of-financial-ratio-analysis-to-an-investor
[Accessed 20 May 2025].
My Assignment Help. 'The Importance Of Financial Ratio Analysis To An Investor' (My Assignment Help, 2017) <https://myassignmenthelp.com/free-samples/the-importance-of-financial-ratio-analysis-to-an-investor> accessed 20 May 2025.
My Assignment Help. The Importance Of Financial Ratio Analysis To An Investor [Internet]. My Assignment Help. 2017 [cited 20 May 2025]. Available from: https://myassignmenthelp.com/free-samples/the-importance-of-financial-ratio-analysis-to-an-investor.