
Does The Intricacy of The Topic Intimidate You?
Tame Your Fear with Unmatched Assignment Help Services from Professional Writers.
1: Introduction
1.1: Aim, Scope and Structure of the Report
1.2 Company Overview
1.2.1: Tesco History and Profile of Activities
1.2.2: Tesco Similarities with its main competitors
1.2.3: Industry Trends
2: Profitability Ratios
2.1 Gross Profit Margin (%)
2.2: Operating Profit Margin Ratio
2.3: Return on Capital Employed
2.4: Return on Shareholders Fund
3: Efficiency Ratios
3.1: Average Inventory Turnover Period (AITP)
3.2: Average Settlement Period for Receivables
3.3: Average Settlement Period for Payables
3.4: Operating Cash Cycle
3.5: Sales revenue to Capital employed
3.6: Sales Revenue per Employee
3.7: Recommendations for the Management
4.1: Current ratio
4.2: Acid Test Ratio (Quick Ratio)
4.3: Gearing Ratio
4.4: Interest Coverage Ratio
4.5: Recommendations
5: Investment Ratios
5.1: Dividend Payout Ratios
5.2: Dividend Cover Ratio
5.3: Gross Dividend Yield Ratio
5.4: Price/Earning Ratio
5.5: Recommendations for Investors
6: Cash flow Statement Analysis
6.1 Cash flow from different activities
6.2: Cash Flow per Share
7: Limitations
References
Appendices
Appendix 1: Ratio Analysis
Appendix 2: Financial Statements
Financial Statements 2012-13
Financial Statement 2010-11
Financial Statements 2009
Tesco PLC is a British based multinational retail company that deals in grocery and general merchandise. Tesco operates in many countries like the United Kingdom, China, Malaysia, Korea, Ireland and India. It offers various kinds of products that include food, general merchandise, clothing, and electrical products.
In the last 5 years, the company has showed an improved performance and was able to expand its market share. It has been observed that Tesco PLC faced a weaker performance in context to net operating profit when its ratios were compared with its competitors (Sainsbury, Morrisons, and Marks & Spencer).
The main motive of this report is to analyse the financial performance of Tesco PLC in the retail industry and compare its performance with its main competitors in the same industry.
The performance of Tesco Plc is analysed in this report and Tesco PLC is a retail industry that is compared with its competitors, which are Sainsbury Plc, M&A and Morrisons Supermarkets PLC.
The overview of the company is presented first, where the history and the profile of the company is described. In the next chapter, the similarities and differences between Tesco PLC and its competitors will be outlined. After this, the performance of Tesco will be analysed from different perspectives. Finally, recommendations are provided which will help the company to improve its performance.
Tesco is the UK based retail store which operates in grocery sector and primarily offers food products, electronic products and general merchandising. It is the third largest retail store in terms of revenue and has diversified its products. It is working in retail banking; financial services operate in the sector of property and help in analysing the data in terms of property. It has about 3146 stores in the UK and about 2131 stores in Asia with about 6612 stores in different parts of the world. It is a type of company which works around its customers and colleagues (A business for a new decade. 2011).
Profitability Ratios
It was founded by Jack Cohen in the year 1919, who was working in a market stall in the East End of London. It is operating in about 12 different countries across the globe. It has launched first online grocery store in Central Europe and is providing a number of fresh and frozen food products to its customers. It has also launched an Everyday Value range which has its main focus on three areas, namely quality, healthier food products and improved packaging that will help the customers to recognise the products easily (Tesco PLC, 2014).
It has segmented the market area into four different categories which are Tesco Extra, Metro, Express and Superstore. The three big ambitions of the company are to create a large number of opportunities for the customers, improve the health of the customers by providing the best food products and the aim at reducing the wastage of food. The essentials of the company are that the company trades its responsibility such that the impact on environment is reduced. The local community is supported by the essentials of Tesco and is behaving as a great employer (Tesco PLC, 2014).
The competitors of Tesco are Sainsbury Plc, M&A and Morrisons Supermarkets PLC which are operating in retail sector. The similarity between these stores is that these stores have a similar business operation and these companies sell drinks, food, non-food articles and grocery products to the customers. All these companies provide the food particles and focus manly on the quality of the food particle, maintain the food such that the wastage of the food material can be maintained and fresh food products are provided to the customers so that the health of the customers can be preserved. All these retail stores work by keeping in mind the impact of its activities on the environment. They have developed a multi-channel to provide the products and reach easily to the customers (Tesco, 2014, M&S, 2014, Morrisons, 2014 and Sainsbury, 2014).
The dissimilarity between these stores can be analysed in terms of number of stores operating in the UK shown below:
- Tesco- 1507 stores in the UK (Annual Report and Financial Statements, 2013)
- M&A- 766 stores in the UK (Annual Report and Financial Statements, 2013)
- Sainsbury- 1106 stores in the UK (Annual Report and Financial Statements, 2013)
- Morrisons- 569 stores in the UK (Morrisons, 2014).
Market Share
The UK retail sector employs about 10% of the UK workforce and consistently accounts for more than five percent of the value generated by the UK economy each year. The UK retail market is dominated by five large retailers that account for about 75% of the total food and drink market.
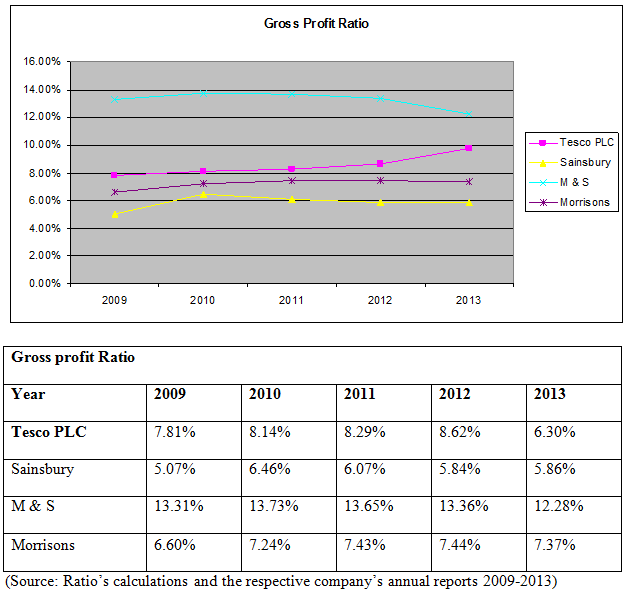
Gross profit margin calculates the amount of gross profit earned on the amount of total sales. It reflects the difference between the total sales revenue to cost of sales. It is the best indicator of profitability as it shows the profits earned on the amount of total expenses incurred. Tesco PLC shows a weaker performance as compared to Marks and Spencer.
On looking at figures of gross profit and cost of sales separately, it can be concluded that both the amounts have increased in the last five years. Gross profit has increased at a higher rate as compared to cost of sales.
Efficiency Ratios
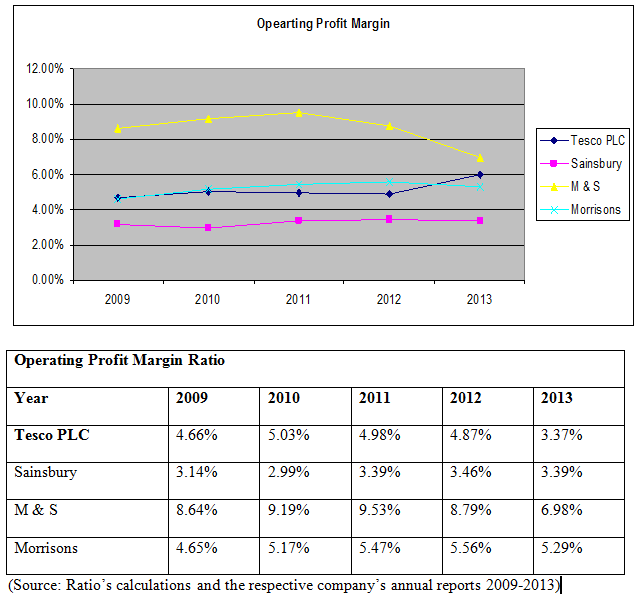
Operating profit margin ratio indicates the relation of operating profit to sales revenue. This ratio is regarded as the most important measure of profitability as it measures the company’s operational performance.
When the operating profit ratio of Tesco PLC is compared to its competitors, it is found that Tesco PLC has low operating profit margin. This ratio was decreased by 1.50 % in the year 2013 when it was compared with the ratio in the year 2012. It is due to decrease in administrative expenses and increase in sales revenue from the previous year (Sagner, 2010).
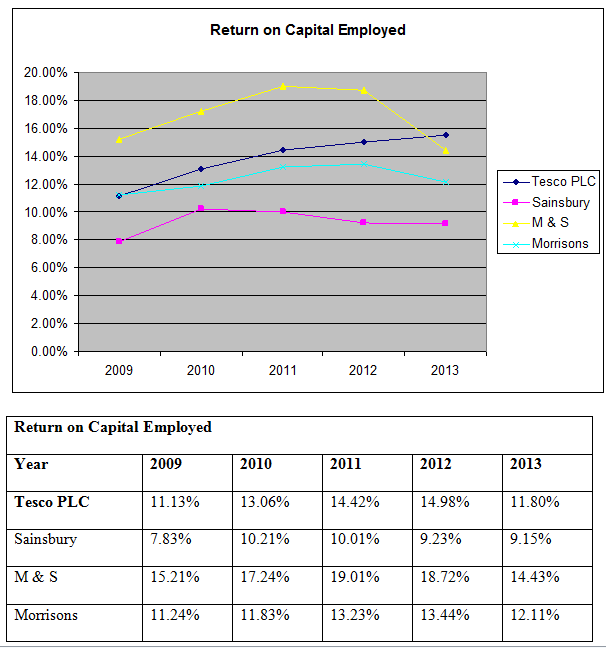
The return on capital employed reflects the earnings of the firm earned on the capital invested in the assets of the firm. The return on capital employed shows the percentage of return a company earns from its assets. It can be calculated through dividing the net income by average total assets.
While comparing ROCE of Tesco PLC with its competitors, it was found that it has maintained a higher profitability as compared to other major players in the industry. There is a significant increase in the return on capital employed by Tesco from 14.98% in 2012 to 15.51% in 2013. However, it can be concluded that competitors of Tesco PLC were able to use their funds more efficiently in order to generate more revenue (Fridson and Alvarez, 2011).
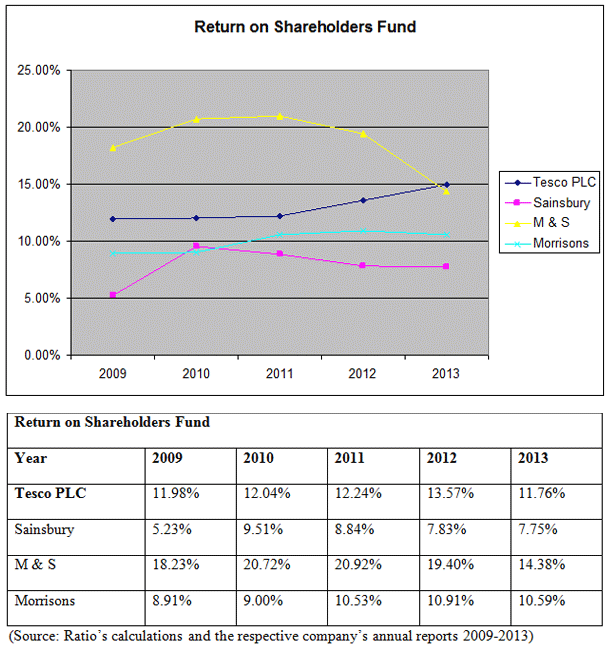
Return on shareholder’s fund ratio (ROSF) calculates the amount of profit earned by the company on the total invested equity fund. This ratio relates the profit distributed to the owners of a company for a given time period. Generally, companies try to get high value in this ratio in order to build good image among the public.
On comparing Tesco’s performance with the performance of its competitors, it was found that Tesco has achieved the highest return among all its competitors involved in the analysis. All the credit of this performance can be given to senior managers for their extra ordinary performance and hard work (Walton, 2000).
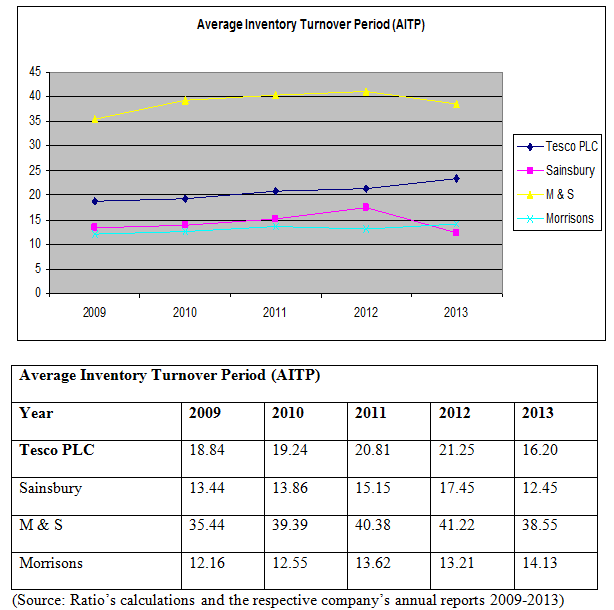
AITP ratio indicates how fast the stocks of a company are turned over. On analysing the ratio of Tesco PLC and its competitors it can be said that Tesco’s efficiency is average as compared to other players in the industry. It can be said that there is a trend of an extension of the inventory turnover ratio in all the companies.
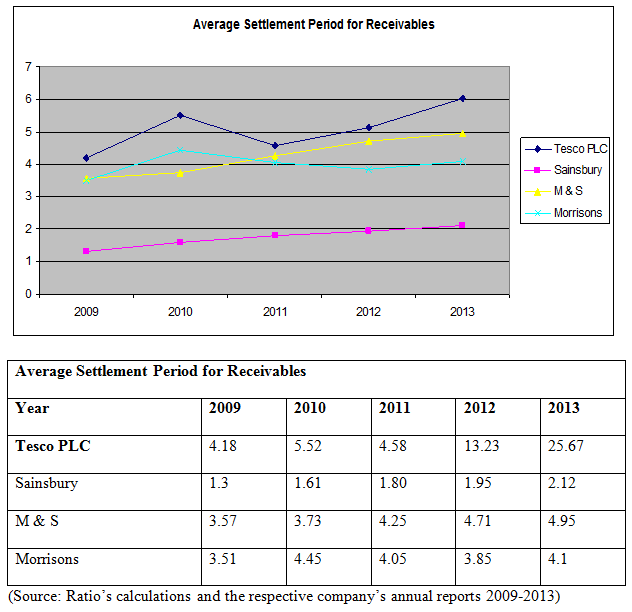
Average Settlement Period for Receivables compares the trade receivables to the credit sales. It was found that Tesco has the highest average settlement period for receivable when it compared with other competitors in the industry.
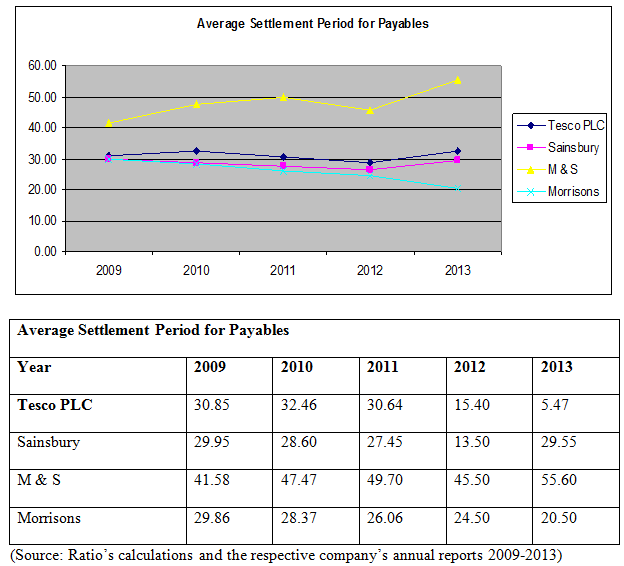
Average settlement period of payables measures how long a company takes to pay to its suppliers. Comparisons between all the companies show that Morrisons has the lowest payable period in all the companies. Tesco PLC has a payable period of 15.40 days in the year 2012.
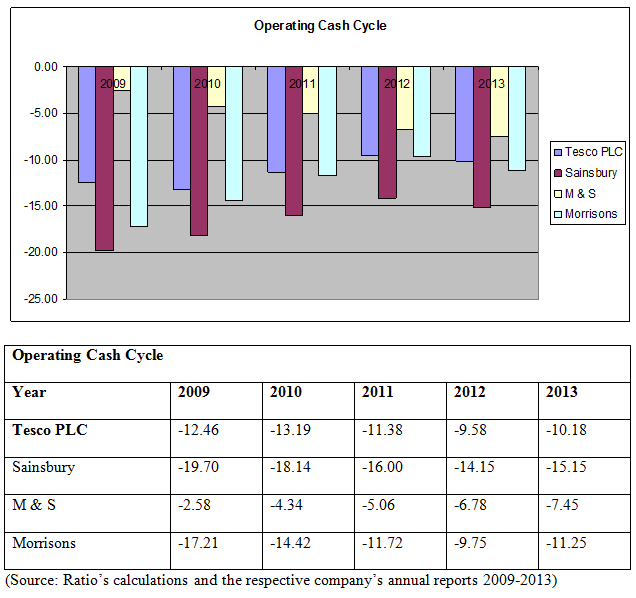
The operating cash cycle shows the period between the payment of purchase of goods and the receipt of cash of goods sold. The operating cash cycle of all the companies shows that M & S is having the longest operating cash cycle. Thus, a long cycle of the company shows that it has greater financing requirement for the business.
Investment Ratios
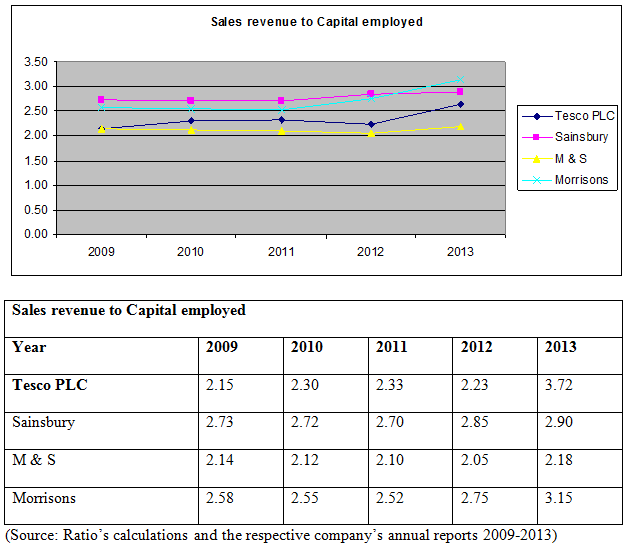
The ratio indicates the total sales to the capital employed in the business. As evident from the figures above, it can be seen that Sainsbury has the largest ratio of sales revenue to the capital employed (Bull, 2007). Thus, the ratio indicates the growth and profitability of the company as it reflects the total sales on the capital employed in the business. Tesco has 2.23 of sales revenue to the capital employed ratio in the year 2012.
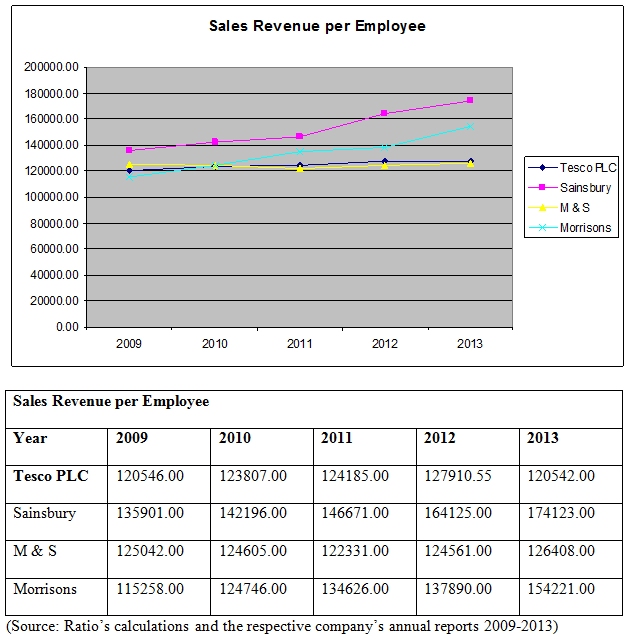
The ratio indicates the sales revenue of the company in context to per employee. The ratio is highest for Sainsbury and it indicates more sales revenue of the company in terms of employees. Tesco is having satisfactory sales revenue per employee ratio in the year 2012.
Thus, the management on the basis of above figure of ratios is recommended for increasing its profitability as compared to other companies. The company is recommended to increase its profitability in order to remain ahead of its competitors in the retail market.
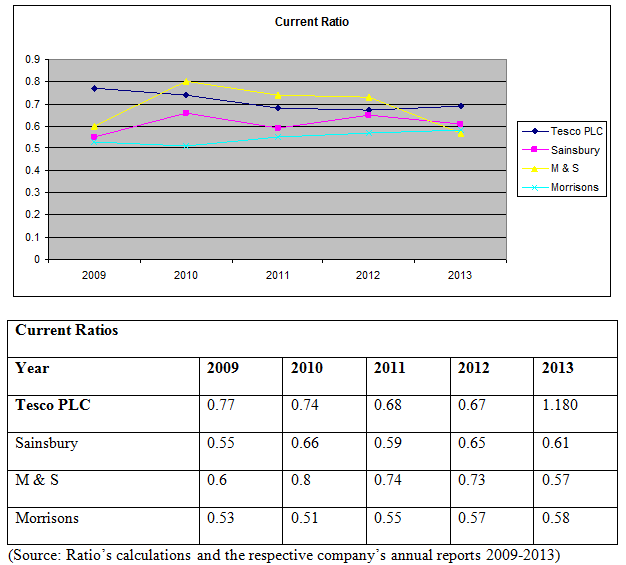
Current ratio reflects the liquidity position as it provides the ratio of current assets to current liabilities, and there is a decline in the current ratio of Tesco. This indicates that there is a decline in the liquidity of a company.
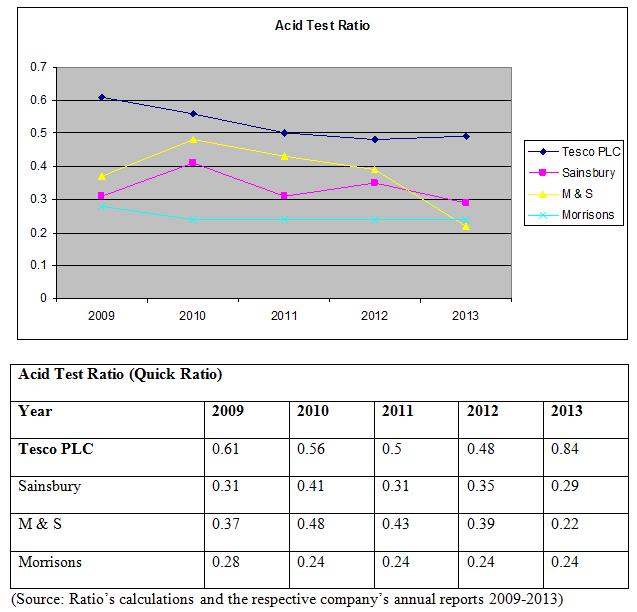
The acid test ratio reflects the true picture of the liquidity position of Tesco. There is a decline in the ratio at a slow pace in comparison to the competitors such as Sainsbury, Morrisons, etc.
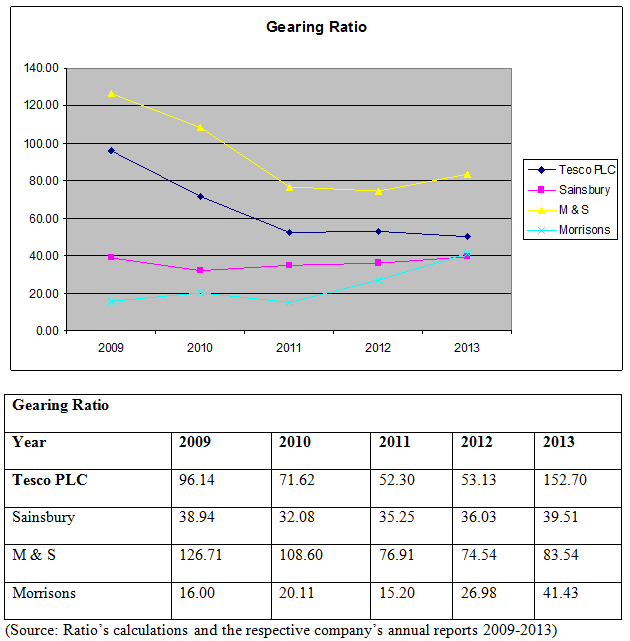
Gearing ratio provides information about the total indebtedness of a company. The gearing ratio of Tesco has declined over the years, which shows that Tesco has a lower debt in comparison to other players in the market.
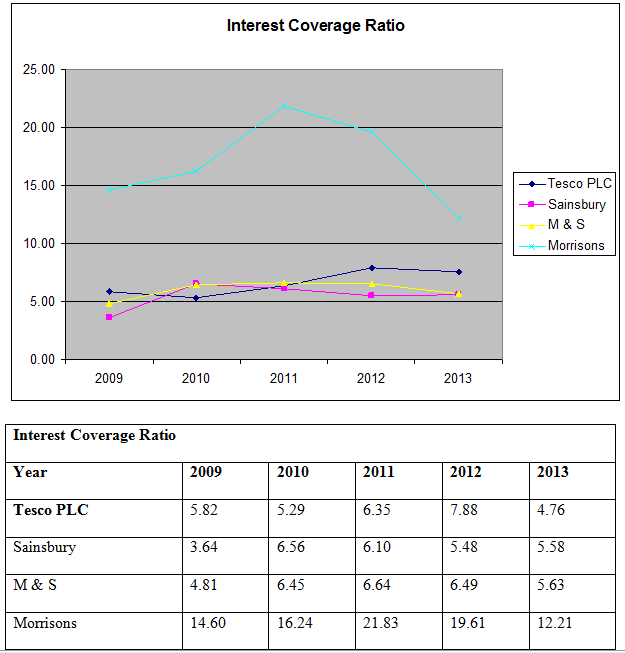
Interest coverage ratio provides information about the covering of the interest payable by operating profit. There is an increase in the ratio of Tesco PLC which shows the risk for lenders, as they are confirmed that their interest will be paid back to them.
The liquidity position of Tesco and the gearing ratio of the company indicate that the debts of the company are in a good position.
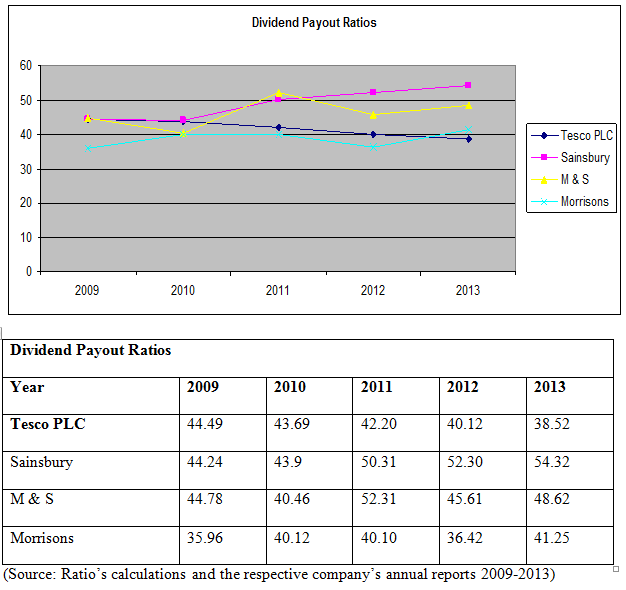
Dividend payout ratio reflects the amount of dividend paid to the shareholders of the company. Higher the ratio means that shareholders are getting high returns on the investment. There is a decline in the ratio of Tesco which shows that the company has high retained earnings.
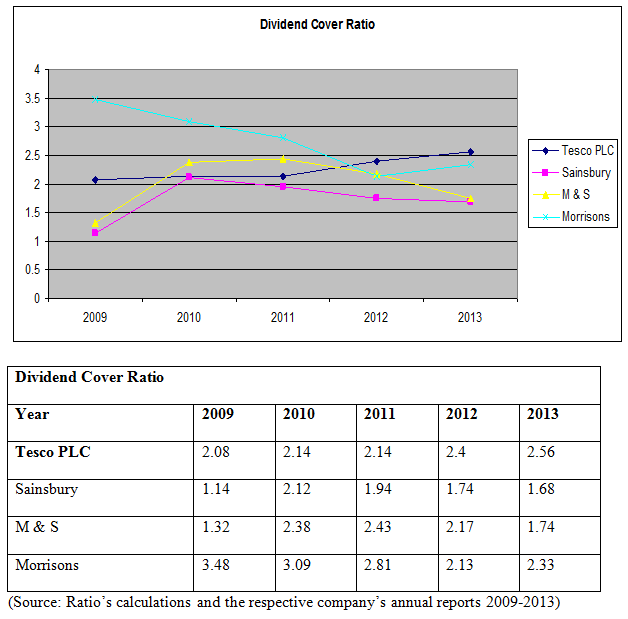

This ratio helps investors to assess returns on their investment. Decrease in the ratio affects the decision of investors regarding investment.
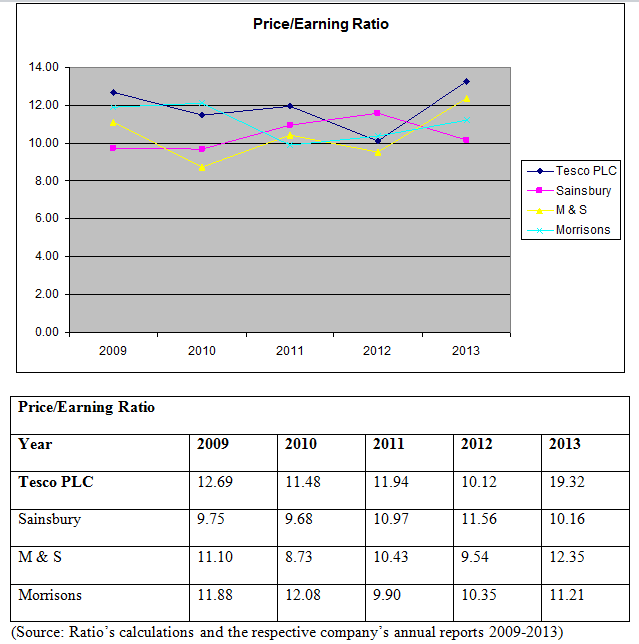
The price earning ratio of Tesco has declined and it shows the earning of Tesco from the price. It enables in assessing the confidence level of the market on the company. The above table indicates that the market has gained a confidence on the performance of Tesco (Drake and Fabozzi, 2012).
The ratios regarding the investment shows that investors are attracted towards the company as the investment ratios are in a good state. They are encouraged to make investment in the company to earn high returns.
Cash flow Statement Analysis
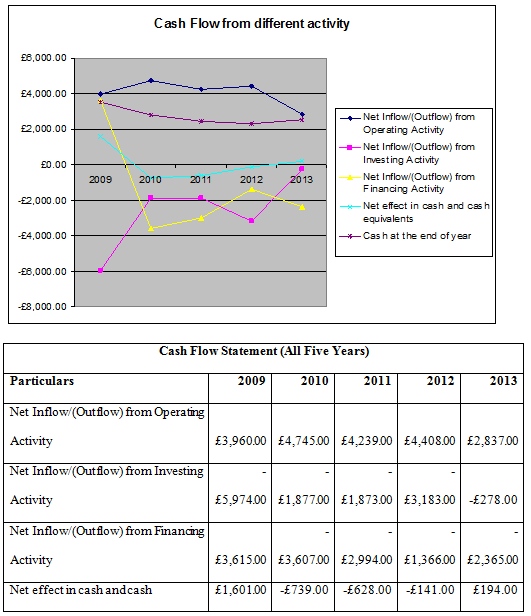
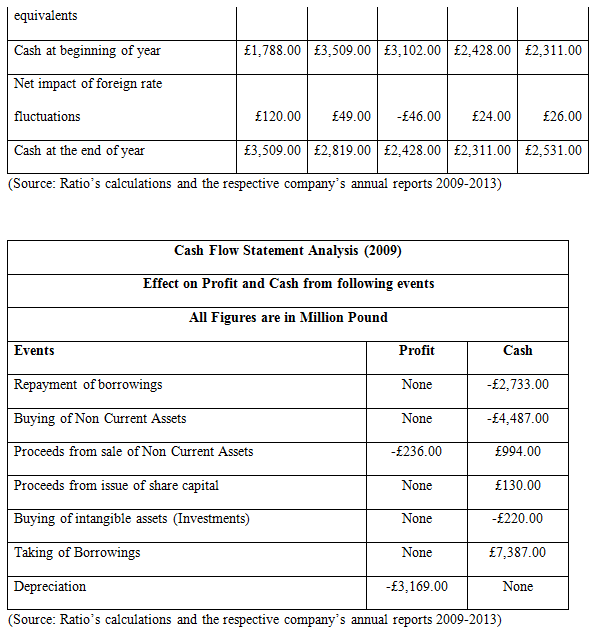
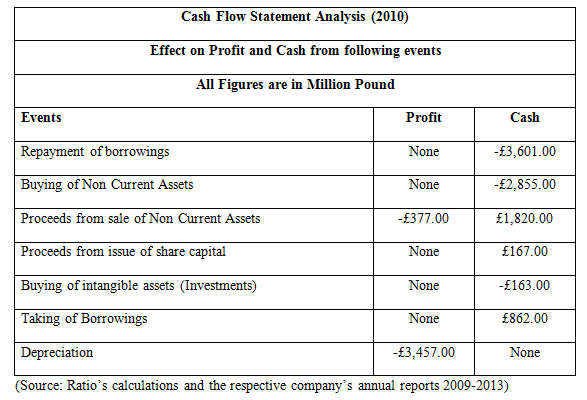
On analysing the overall impact of operating, financing and investing activity on the cash flow of Tesco Plc, it can be concluded that the company has maintained sufficient amount of cash at the year end in order to finance its major activities. In all the five years, the company borrowed the interest bearing loan from banks or financial institutions to provide sufficient cash for working capital purpose. The Company has used most of its cash either for purchasing non current assets or buying inventories for resale purpose. Tesco Plc has also earned the benefit of foreign rate fluctuation in all five years. Tesco Plc has also used equity capital to provide some more funds to different activities. The overall analysis shows that the company has used its cash in best possible manner available to the company.
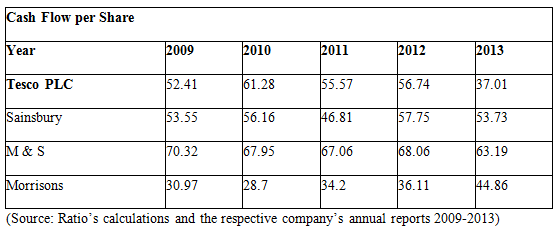
The analysis of the cash flow statement indicates that there is a decline in the cash flow per share which represents that there is an inflow of cash in the company.
The ratio analysis of the company shows that ratios are an important tool for analysing the performance of the company as they reflect the growth and profitability of the company. But the ratios are not the real representatives of the financial position of the company as they reflect the company’s position only for a particular time period. It can be said that financial ratios is not a perfect tool to represent the exact financial position of the company for any financial year because these ratios are based on the financial statements published by the company and these statements are only the snapshot of the company at a given point of time. It is advised to perform the ratio analysis at many points in the year for having a through interpretation of the company’s performance.
Analysis using financial ratios is based on the financial statements of the company but it contains some limitations. Ratio analysis generally considers all the parts in the financial statements, although it leaves some of the important factors that play a major role in interpreting the financial position of the company. It is also true that all the financial and non financial information is not available in the financial statement of the company, which makes it difficult for the analyst to carry out its analysis perfectly.
Annual Report and Financial Statements 2013.
Annual Report and Financial Statements 2013.
Annual Report and Financial Statements 2013.
Bull, R. 2007. Financial Ratios: How to use financial ratios to maximise value and success for your business'. Elsevier.
Drake, P. P. and Fabozzi, F. J. 2012. Analysis of Financial Statements. John Wiley & Sons.
Fridson, M. S. and Alvarez, F. 2011. Financial Statement Analysis: A Practitioner's Guide. John Wiley & Sons.
J. Sainsbury plc. 2009. Annual Report and Financial Statements 2009.
J. Sainsbury plc. 2010. Annual Report and Financial Statements 2010.
J. Sainsbury plc. 2011. Annual Report and Financial Statements 2011.
J. Sainsbury plc. 2012. Annual Report and Financial Statements 2012.
J. Sainsbury plc. 2013. Annual Report and Financial Statements 2013.
M&S. 2014.
Marks and Spencer. 2009. Annual Report and Financial Statements 2009.
Marks and Spencer. 2010. Annual Report and Financial Statements 2010.
Marks and Spencer. 2011. Annual Report and Financial Statements 2011.
Marks and Spencer. 2012. Annual Report and Financial Statements 2012.
Marks and Spencer. 2013. Annual Report and Financial Statements 2013.
Morrisons. 2009. Annual Report and Financial Statements 2009.
Morrisons. 2010. Annual Report and Financial Statements 2010.
Morrisons. 2011. Annual Report and Financial Statements 2011.
Morrisons. 2012. Annual Report and Financial Statements 2012.
Morrisons. 2013. Annual Report and Financial Statements 2013.
Morrisons. 2014.
Sagner, J. 2010. Essentials of Working Capital Management. USA: John Wiley & Sons.
Sainsbury. 2014.
Tesco Plc. 2014.
Tesco. 2009. Annual Report and Financial Statements 2010.
Tesco. 2011. Annual Report and Financial Statements 2011.
Tesco. 2012. Annual Report and Financial Statements 2012.
Tesco. 2013. Annual Report and Financial Statements 2013.
Appendix 1- Gross Profit Margin
Formula = Gross Profit/ Sales Revenue * 100
Tesco Gross Profit Margin (2013)
4089/ 64,826 * 100 = 6.3%
Appendix 2- Operating Profit Margin
Formula = Operating Profit/ Sales Revenue * 100
Tesco Operating Profit Margin (2013)
2188/ 64,826 * 100 = 3.37%
Appendix 3- Return on Capital Employed (ROCE)
Formula = Operating Profit (current year) / Equity (end of last year) + long term loans (end of last year) * 100
Tesco Return on Capital Employed (ROCE)
2188/ 17801+688 *100
= 2188/ 18489 * 100 = 11.8%
Appendix 4-Return on Shareholders’ Funds (ROSF)
Formula = Profit after tax/ Shareholder’s funds
Tesco Return on Shareholders’ Funds (ROSF)
1960/ 16,661 * 100 = 11.76
Efficiency Ratios
Appendix 5- Average Inventory Turnover Period
Formula =
Tesco Average Inventory Turnover Period
60,737/3744 = 16.2
Appendix 5- Average Settlement Period for Receivables
Formula = Credit sales / Average Receivables
Tesco Average Settlement Period for Receivables
= 64,826 / 2,525: 25.67 days
Appendix 6- Average Settlement Period for Payables
Formula = Credit Purchases / Average Purchases
Tesco Average Settlement Period for Payables
= 60,737/ 11,094: 5.47 days
Appendix 7- Operating Cash Cycle
Formula = Days Inventory Outstanding + Days Sales Outstanding – Days Payable Outstanding
Tesco Operating Cash Cycle
= 12.30 + 14.20 – 26.50 = -10.18 days
Appendix 8- Sales revenue to Capital employed
Formula = Sales revenue / Capital employed
Tesco Sales revenue to Capital employed
= 64,826 / (16,661+ 759) = 3.72
Appendix 9- Sales Revenue per Employee
Formula = Sales Revenue / No of employees
Tesco Sales Revenue per Employee
= 64,826 / 537,784 = 120542.82
Appendix 10- Current Ratio
Formula = Current assets/ Current Liabilities
Tesco Current Ratio
= 13,096/ 11,094 = 1.180
Appendix 11- Acid Test Ratio
Formula = Quick Assets/ Current Liabilities
Tesco Acid Test Ratio
= 9352/ 11094 = 0.84
Appendix 12- Gearing Ratio
Formula: Long term loans / (Equity- Long term loans) *100
Tesco Gearing Ratio
= 10,068/ (16,661- 10,068) * 100 =152.70
Appendix 13- Interest Cover Ratio
Formula: Operating Profit/ Interest Payable
Tesco Interest Cover Ratio
= 2,188/ 459 = 4.76 times
Appendix 14- Dividend Payout Ratio
Formula: (Dividend per share/ Basic Earnings per share) *100
Tesco Dividend Payout Ratio
= (6.66/17.30) *100 = 38.52 %
Appendix 15- Gross Dividend Yield Ratio
Formula: (Dividend per share (end of current year)/ Share Market Value (beginning of current year)) *100
Tesco Gross Dividend Yield Ratio
= (6.66/ 354.49) *100 = 1.878
Appendix 16- Price/Earnings Ratio
Formula: Market Price per share/ Earning per share
Tesco Price/Earnings Ratio
= 334.35 / 17.30 = 19.32
Appendix 2: Financial Statements
Financial Statements 2012-13
To export a reference to this article please select a referencing stye below:
My Assignment Help. (2015). Understanding Tesco Financial Performance: Ratio Analysis. Retrieved from https://myassignmenthelp.com/free-samples/tesco-plc-ratio-analysis.
"Understanding Tesco Financial Performance: Ratio Analysis." My Assignment Help, 2015, https://myassignmenthelp.com/free-samples/tesco-plc-ratio-analysis.
My Assignment Help (2015) Understanding Tesco Financial Performance: Ratio Analysis [Online]. Available from: https://myassignmenthelp.com/free-samples/tesco-plc-ratio-analysis
[Accessed 09 May 2025].
My Assignment Help. 'Understanding Tesco Financial Performance: Ratio Analysis' (My Assignment Help, 2015) <https://myassignmenthelp.com/free-samples/tesco-plc-ratio-analysis> accessed 09 May 2025.
My Assignment Help. Understanding Tesco Financial Performance: Ratio Analysis [Internet]. My Assignment Help. 2015 [cited 09 May 2025]. Available from: https://myassignmenthelp.com/free-samples/tesco-plc-ratio-analysis.